The hidden risks behind a good looking backtest
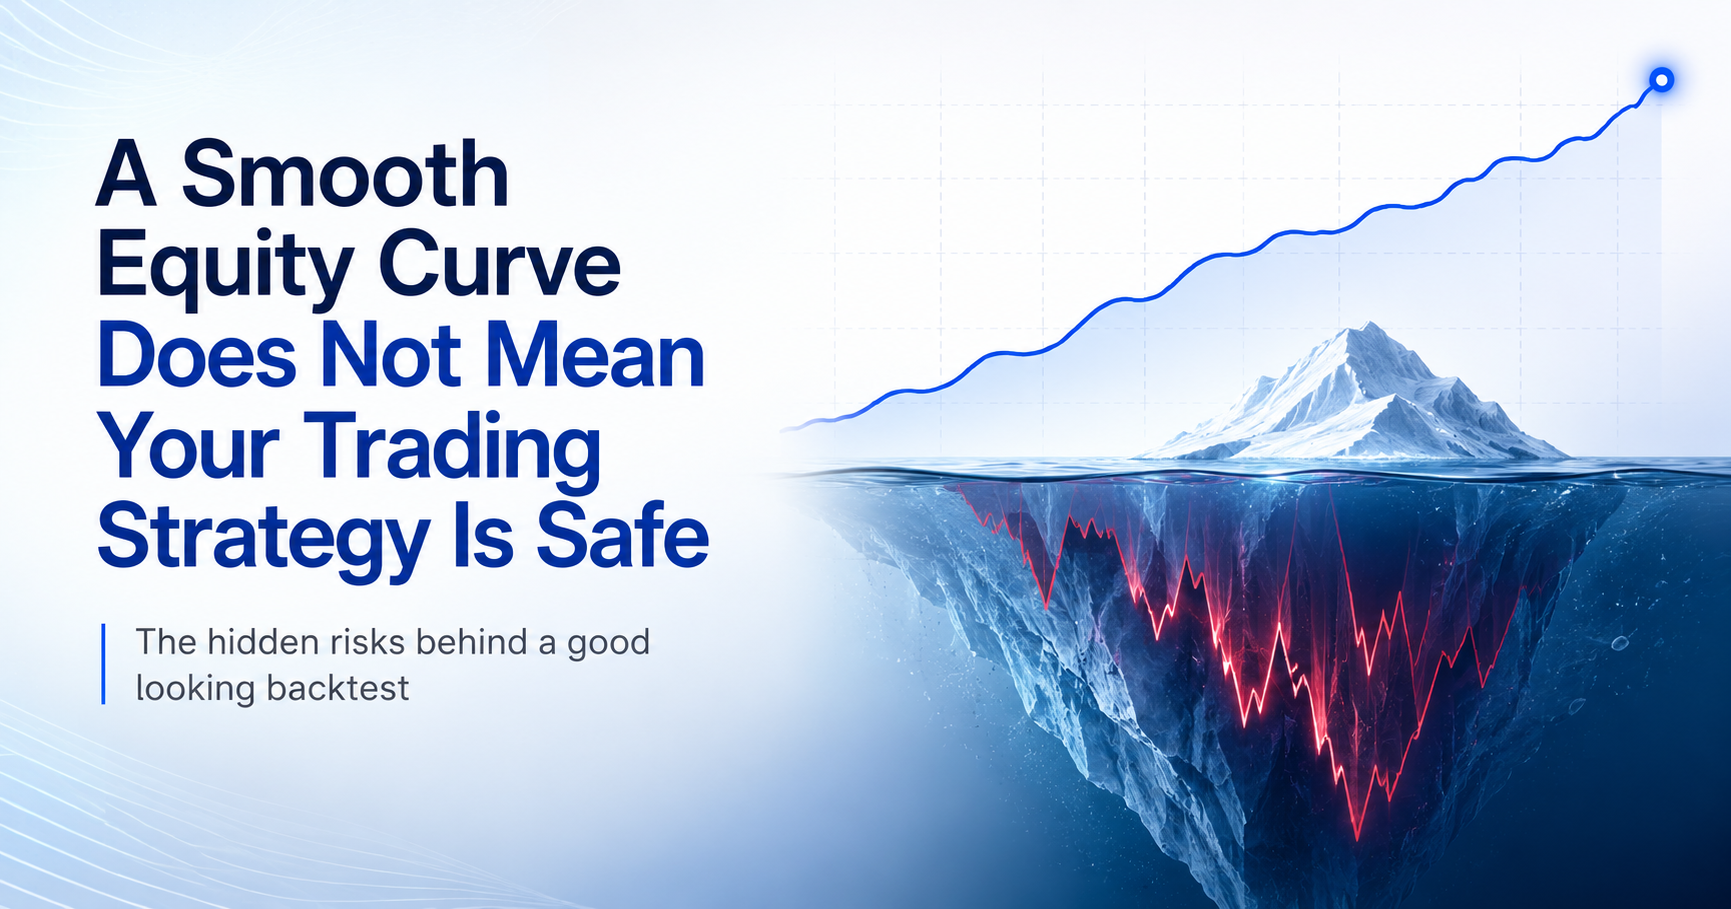
A smooth equity curve can be one of the most convincing things in trading.
You test a strategy, the line moves steadily upward, the account balance grows, the drawdown does not look too scary, and the strategy immediately feels promising. It is easy to look at that chart and think, this works. But an equity curve is only the surface.
It shows what happened to the account balance during a specific test period. It does not fully explain why it happened, how reliable the result is, or whether the same behaviour is likely to survive real trading. A strategy can have a beautiful equity curve and still be fragile.
It can depend on a few lucky trades. It can ignore fees and slippage. It can be fitted too closely to past data. It can work only in one type of market. It can hide painful drawdowns that most traders would not tolerate in real time. This is why traders should never judge a strategy by the shape of the curve alone. A good equity curve is useful, but it is not proof.
What an equity curve actually tells you
An equity curve shows how the value of a trading account changes over time. In a backtest, it shows how the strategy would have performed on historical data. In live trading, it shows how the strategy actually performed over time. It helps answer simple questions.
Did the strategy grow capital?
Did the account suffer large drops?
Did the strategy recover after losses?
Was growth steady or unstable?
Did performance come from gradual gains or sudden jumps?
These are useful questions, but they are not enough. An equity curve does not automatically tell you whether the trades were realistic, whether the costs were included, whether the strategy was tested across different market conditions, or whether the result came from repeatable behaviour. A clean looking curve can create false confidence if you do not look deeper.
A few trades may be carrying the whole result
One of the most common problems with a good looking equity curve is that most of the profit may come from a small number of trades.
At first glance, the strategy may look consistent. But when you inspect the trade log, you may find that two or three trades created most of the total profit. That is not always bad.
Some strategies are designed to catch rare large moves. A trend following strategy, for example, may take many small losses and wait for a few large winners. But the trader needs to know this clearly. There is a big difference between a strategy that makes steady profits across many trades and a strategy that looks good because of one exceptional market move. If a five year backtest depends heavily on a few trades, the next question should be simple.
What happens if those trades do not appear in the future. If the strategy becomes weak without those few winners, the equity curve may be less reliable than it looks.
The curve may hide painful drawdowns
A strategy can finish the test period in profit and still be extremely difficult to trade. This is because final return does not show the full emotional and financial journey. Imagine a strategy that ends the year up twenty percent. That sounds good. But if the same strategy spent four months down fifteen percent before recovering, the experience would feel very different in real time.
Many traders abandon strategies during drawdowns, even if the long term result later improves. This is why drawdown matters. Drawdown shows how far the account falls from a previous high. But traders should also look at how long the drawdown lasted. A short drawdown can be uncomfortable. A long drawdown can test patience, discipline, and confidence. Before trusting a strategy, ask these questions.
How deep was the worst drawdown?
How long did recovery take?
Did the drawdown happen once or repeatedly?
Would I still follow the strategy during that period?
A strategy that looks good at the end of a backtest may still be unrealistic for the trader using it.
Fees and slippage can change the entire result
Many backtests look better than they should because they ignore real trading costs. Fees are the charges paid to place trades. Slippage is the difference between the price you expected and the price you actually got. These may sound small, but they can change the result completely. This is especially true for strategies that trade frequently or aim for small profits per trade. A strategy that makes a small average profit on each trade may look strong before costs. After fees, spreads, and slippage, that same strategy may become weak or even unprofitable. This is one of the biggest reasons traders should be careful with clean, smooth backtests. If the backtest does not include realistic trading costs, the equity curve may be showing an ideal version of the strategy, not a practical one. A better test should include fees, estimated slippage, and realistic execution assumptions.
If a strategy only works when costs are ignored, it probably does not work.
The strategy may be overfitted to the past
Overfitting happens when a strategy is adjusted too closely to historical data. This usually starts innocently. A trader tests a strategy. The result is not good enough. So they change an indicator setting. Then they adjust the stop loss. Then they change the take profit. Then they add another filter. Then they change the date range. Eventually, the backtest starts looking excellent. But the strategy may not have become stronger. It may have simply become better at matching the past.
That is a serious problem.
Markets do not repeat in exactly the same way. A strategy that has been shaped too tightly around one historical period may fail when conditions change. A smooth equity curve can hide this. The more a strategy has been adjusted just to improve the backtest, the more carefully it should be tested on fresh data. A good question to ask is this.
Did I build this strategy from a clear trading idea, or did I keep changing it until the chart looked good.
If the answer is the second one, the backtest may be less trustworthy.
The strategy may only work in one market condition
Markets do not behave the same way all the time.
Sometimes they trend strongly.
Sometimes they move sideways.
Sometimes volatility is low.
Sometimes price moves become sharp and unpredictable.
A single equity curve can hide the fact that a strategy only worked well in one environment. For example, a breakout strategy may perform well when markets are trending, but struggle when price keeps moving sideways. A mean reversion strategy may perform well in range bound markets, but suffer when price keeps moving strongly in one direction. The total backtest may still look good if the favourable period was strong enough. But that does not mean the strategy is reliable across conditions. This is why traders should break down performance by market environment.
How did the strategy perform in trending markets?
How did it perform in sideways markets?
How did it behave during high volatility?
How did it behave during calm periods?
Did one market phase create most of the profit?
Did one bad phase create most of the losses?
A good strategy review should not only ask whether the strategy made money. It should ask where it made money, where it struggled, and whether those weaknesses are acceptable.
The trade log may reveal what the chart hides
The equity curve gives you the summary. The trade log gives you the story. A trade log shows each entry, exit, profit, loss, position size, and trade duration. It helps you understand whether the strategy behaved the way it was supposed to behave. This matters because a good looking curve can hide strange behaviour.
The strategy may be entering too late. It may be exiting too early. It may be taking trades that do not match the original idea. It may be making money from one symbol while losing on others. It may be holding losing trades for too long. It may be using unrealistic fills. It may be taking too much risk on certain trades. You cannot see all of this from the equity curve alone. Before trusting a strategy, traders should inspect the trade log and ask.
Do the trades match the strategy rules?
Are losses controlled?
Are position sizes consistent?
Are there any unusually large winners or losers?
Are entries and exits realistic?
Is the strategy behaving in a way I actually understand?
If the trade log does not make sense, the equity curve should not be trusted blindly.
A small sample can create false confidence
A strategy with a small number of trades can look excellent by chance.
If a backtest has only twenty or thirty trades, the result may not say much. A few lucky outcomes can make the curve look smooth. A few unlucky outcomes can make a decent idea look worse than it is. Sample size matters because trading results are noisy. The fewer trades you have, the more careful you need to be. This does not mean every strategy needs thousands of trades. Some strategies naturally trade less often. But a low trade count should reduce confidence in the result. A trader should not treat a small sample backtest as strong evidence. Instead, they should ask.
How many trades were taken?
Was the test period long enough?
Did the trades happen across different market conditions?
Is the result too dependent on one period?
Would the strategy still look acceptable if a few trades were removed?
A beautiful curve based on limited evidence is still limited evidence.
Real trading adds pressure that backtests do not show
Backtests are clean. Real trading is not. In a backtest, you already know the full result. You can see that the strategy recovered after a drawdown. You can see that the equity curve eventually moved higher. In real time, you do not know that. When a strategy is losing money for weeks, you do not know whether recovery is coming or whether the strategy has stopped working. That uncertainty changes everything. This is why a strategy must be judged not only by return, but also by whether the trader can realistically follow it.
A strategy with deep drawdowns, long flat periods, frequent losing streaks, or sudden large losses may be difficult to trade even if the final backtest looks good. Good strategy validation should prepare the trader for the bad periods, not just show the good ending.
What to check beyond the equity curve
A good equity curve should be treated as the beginning of the review, not the end. Before trusting a strategy, traders should check the numbers behind the curve. Start with the trade count. A result based on many trades usually gives more information than a result based on a very small sample. Look at the average winning trade and the average losing trade. This shows whether the strategy is properly rewarded when it is right and properly protected when it is wrong. Review the profit factor. This shows whether the strategy made more from winning trades than it lost from losing trades. Study the maximum drawdown. This shows the worst fall from a previous high. Check how long the strategy stayed in drawdown. A deep drawdown is painful, but a long drawdown can be even harder to tolerate. Look at the largest winner and largest loser. This helps show whether the result depends too much on a few unusual trades. Review the longest losing streak. This helps set realistic expectations before using the strategy. Include fees and slippage. A strategy that only works before costs may not be practical. Break performance down by market condition. A strategy that works only in one environment may need stronger filters or more cautious use. Inspect the trade log. The strategy should behave in a way that matches the original rules. Check whether the rules are simple enough to explain. If the logic is too complex to understand, it may be harder to trust. And most importantly, ask whether the strategy would still be acceptable during its worst period, not only at the end of the test.
What a strong validation process looks like
A strong validation process is not about finding the prettiest backtest. It is about understanding the strategy clearly before risking real money.
A trader should know what the strategy is trying to do. They should know when it tends to perform well. They should know when it tends to struggle. They should know what kind of drawdown is normal. They should know whether costs have been included. They should know whether the trade log supports the strategy logic. The goal is not certainty. No backtest can guarantee future results. The goal is better evidence.
A strategy that survives deeper review is more useful than a strategy that only looks good in a summary chart.
Final thought
A smooth equity curve can be encouraging, but it should never be the only reason to trust a trading strategy.
It can hide dependence on a few lucky trades. It can hide painful drawdowns. It can hide unrealistic execution. It can hide overfitting. It can hide poor performance in certain market conditions. It can hide trade behaviour that does not match the original idea.
The curve tells you what happened to the account balance.
It does not tell you everything you need to know.
Before putting real money behind any strategy, look deeper.
Check the trade log. Study the drawdowns. Include fees and slippage. Review the market conditions. Understand the risk. Make sure the strategy rules are clear, repeatable, and realistic.
The goal is not to build a backtest that looks good.
The goal is to build a strategy that can be understood, tested, and handled when conditions are no longer perfect.
Comments
Ask a question or leave feedback. Guests can post too.
Max 2000 characters.
No comments yet.
Quick answers
What is this article about?
A smooth equity curve can make a trading strategy look safe, but it can hide weak assumptions, painful drawdowns, unrealistic costs, overfitting, and dependence on a few lucky trades.
Who should read this article on A Smooth Equity Curve Does Not Mean Your Trading Strategy Is Safe?
This article is for retail traders who want a practical understanding of a smooth equity curve does not mean your trading strategy is safe before moving into backtesting, simulation, paper trading, or broker-connected execution.
What should I do after reading this article?
Use the article to clarify the concept first, then review FlyTradr workflow pages such as the algo trading platform overview, methodology and assumptions, or the FAQs page before making a platform decision.