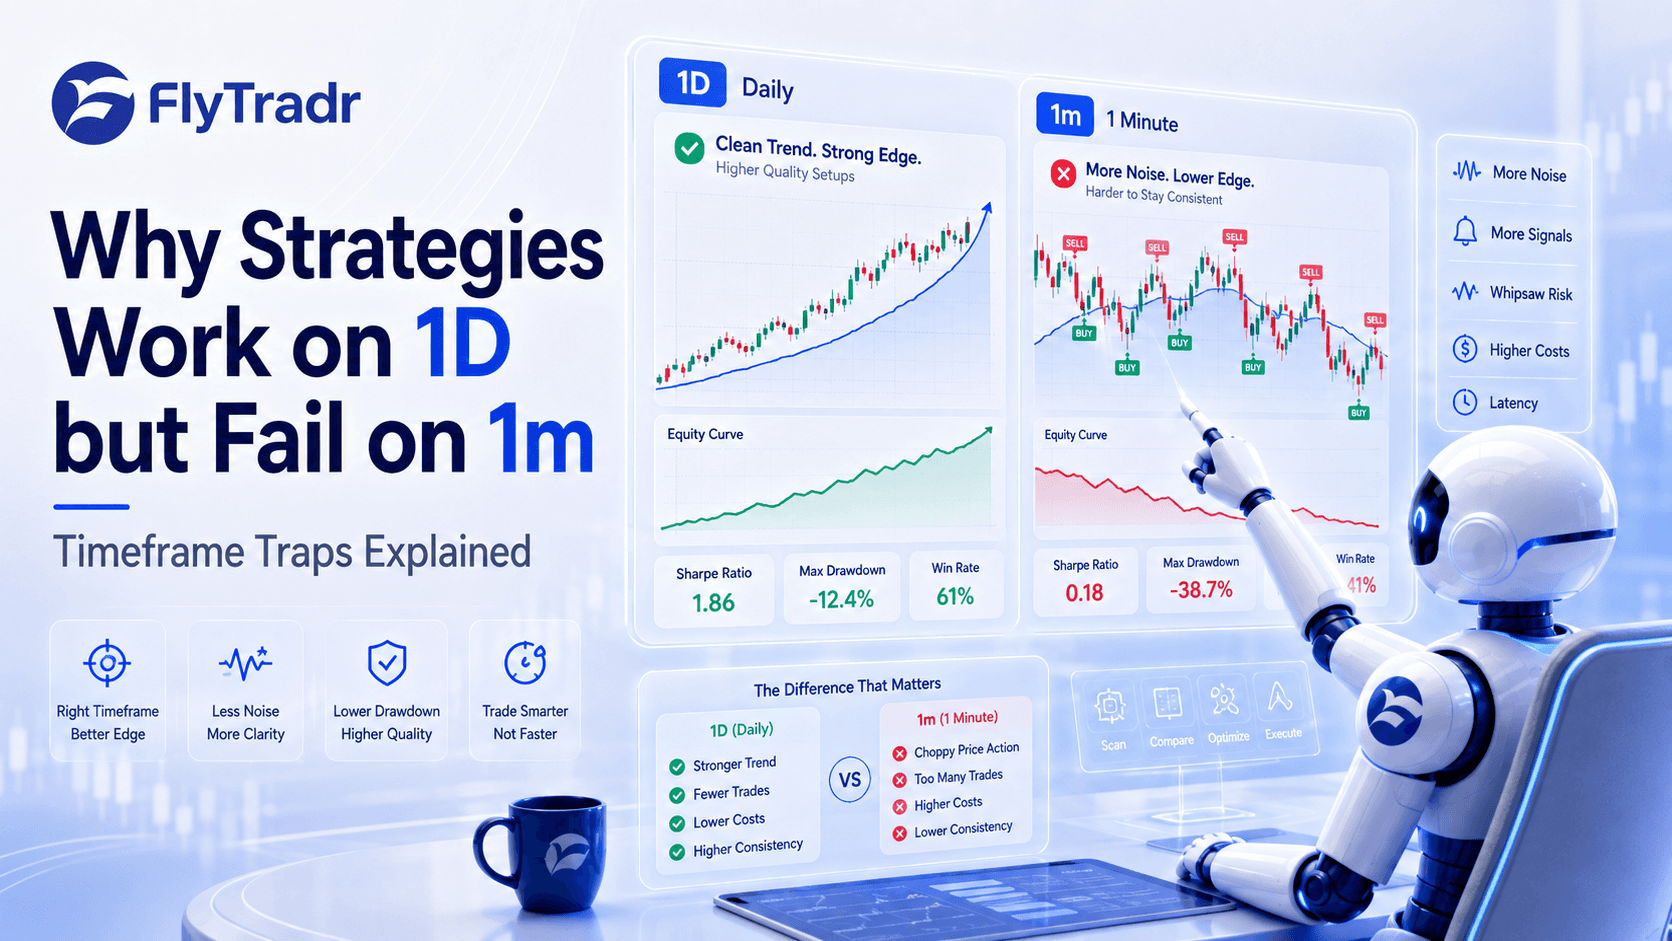
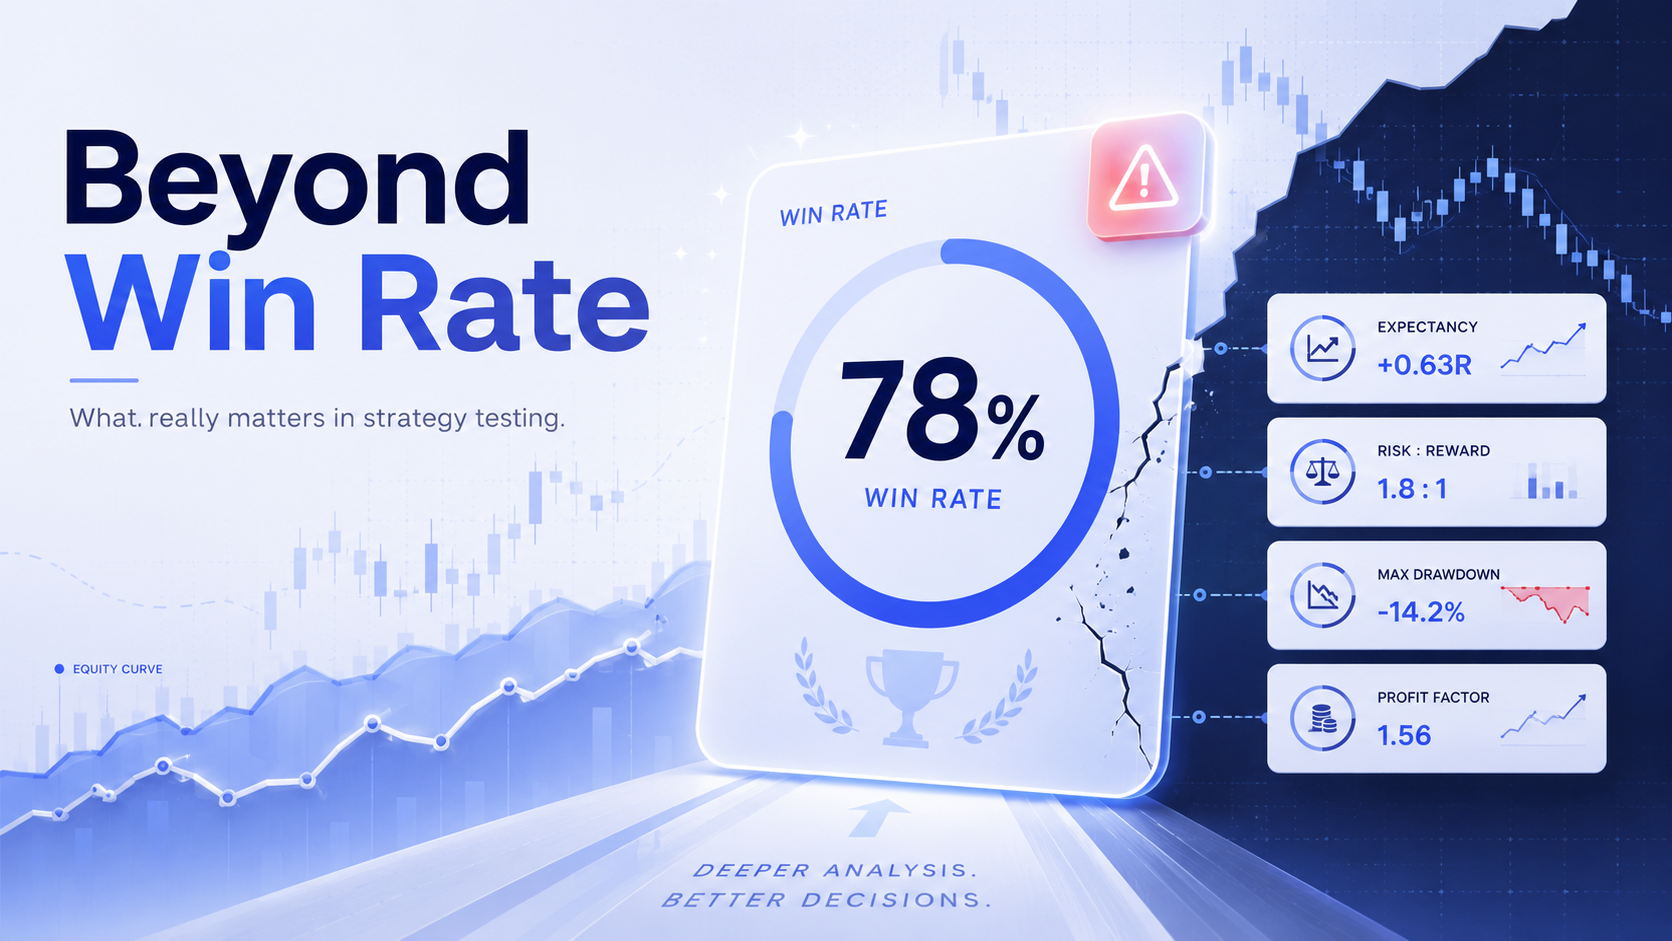
A high win rate can make a weak strategy look safe. Here is how to judge whether your trading system actually has an edge.
Most traders want one number from a backtest before anything else: the win rate. It feels simple. If a strategy wins 70% of the time, it must be good. If it wins only 40% of the time, it must be weak.
But that is not how trading works. A strategy can win most of the time and still lose money. Another strategy can lose more often than it wins and still be profitable over the long run.
Win rate tells you how often your strategy is right, but it does not tell you how much you make when you are right, how much you lose when you are wrong, or whether the strategy can survive real market conditions.
The Danger of Frequency Over Quality
Win rate is the percentage of trades that close in profit. If a strategy takes 100 trades and 60 are profitable, the win rate is 60%. This is useful only as a starting point.
A trader can have a high win rate and still blow up an account if the losing trades are much larger than the winners. Consider two strategies:
Strategy A: Wins 80% of the time. The average win is 1%, but the average loss is 8%. One bad trade wipes out weeks of gains.
Strategy B: Wins 40% of the time. The average win is 4%, and the average loss is 1%. It feels uncomfortable because you lose more often, but it is mathematically superior.
1. Risk-Reward Ratio
The first metric to look at after win rate is the risk-reward ratio. This tells you how much you make on average compared to how much you lose. If your average winner is 2% and your average loser is 1%, your ratio is 2:1. You do not need to win most of your trades to be profitable.
2. Expectancy: The Real Edge
Expectancy is the most important number in your backtest. It combines win rate, average winner, and average loser into one figure.
A positive expectancy means the strategy has an edge.
A negative expectancy means the strategy loses money over time, even with a high win rate.
3. Drawdown and the Sharpe Ratio
Profitability is only half the battle. You must also consider the "smoothness" of your returns.
Maximum Drawdown: This shows how much your account falls from a peak before recovering. If a strategy has a 45% drawdown, most traders will quit before it recovers. Drawdown is a psychological metric as much as a risk metric.
Sharpe Ratio: This helps you understand returns relative to volatility. For systematic traders, the goal is to find a strategy that can survive changing markets without wild equity swings.
4. Profit Factor and Trade Count
Profit factor compares total profits to total losses. A factor of 2.0 means you generated 2 units of profit for every 1 unit of loss. However, this number is only reliable if your trade count is high enough. A backtest with only 12 trades is not evidence. The more trades you have, the more confidence you can have that the performance is not just luck.
Evaluating Your Strategy Properly
Instead of asking about win rate, ask these questions:
What is the expectancy per trade?
What is the maximum drawdown?
How many trades were tested, and did they span different market phases?
Did the backtest include realistic costs and slippage?
How FlyTradr Helps You Look Beyond the Surface
This is why I am building FlyTradr. Most retail traders have strategy ideas, but testing them properly is difficult. You usually have to write code or rely on surface-level tools.
FlyTradr allows you to build, backtest, and validate your own rules without code. Instead of just seeing how often you win, you can analyze the full performance picture, compare parameters, and see if a strategy is robust enough to trust with real capital.
Final Thoughts
Win rate is easy to understand, but easy does not always mean useful. A strong strategy shows a balance between profitability, risk, and consistency. Before you automate, look deeper. Check the expectancy, the drawdown, and the trade count. That is how you move from guessing to professional systematic trading.
Test Your Strategy Before You Trust It
FlyTradr helps you build and automate trading strategies without writing code. Start with a simple idea, test it against historical data, and see if the numbers support it before risking your capital.
Comments
Ask a question or leave feedback. Guests can post too.
Max 2000 characters.
No comments yet.
Quick answers
What is this article about?
A high win rate can make a weak strategy look safe, but it doesn’t guarantee profit.
Who should read this article on Why Win Rate is Misleading, and What Traders Should Track Instead?
This article is for retail traders who want a practical understanding of why win rate is misleading, and what traders should track instead before moving into backtesting, simulation, paper trading, or broker-connected execution.
What should I do after reading this article?
Use the article to clarify the concept first, then review FlyTradr workflow pages such as the algo trading platform overview, methodology and assumptions, or the FAQs page before making a platform decision.