Trading the Snapback: A No-Code Guide to Mean Reversion
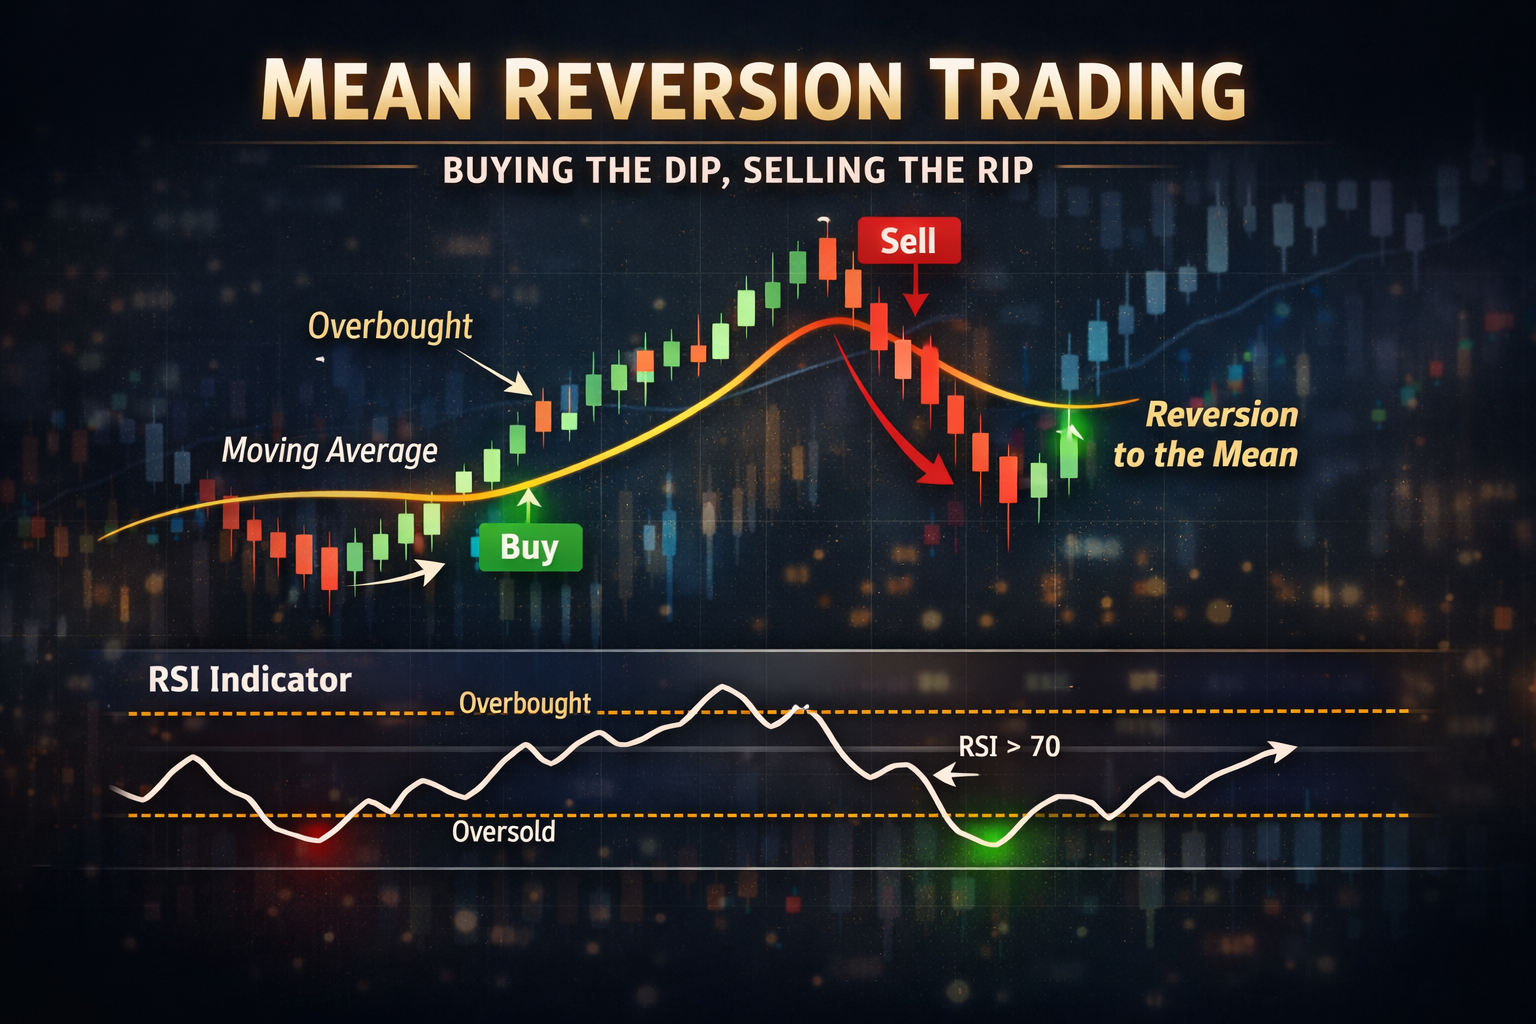
Mean reversion is one of the oldest concepts in trading: when prices stretch too far from their average, they eventually snap back.
It sounds incredibly simple. But this observation—that extremes don't last and markets overcorrect—is the engine behind an entire category of systematic strategies used by both retail quants and institutional desks.
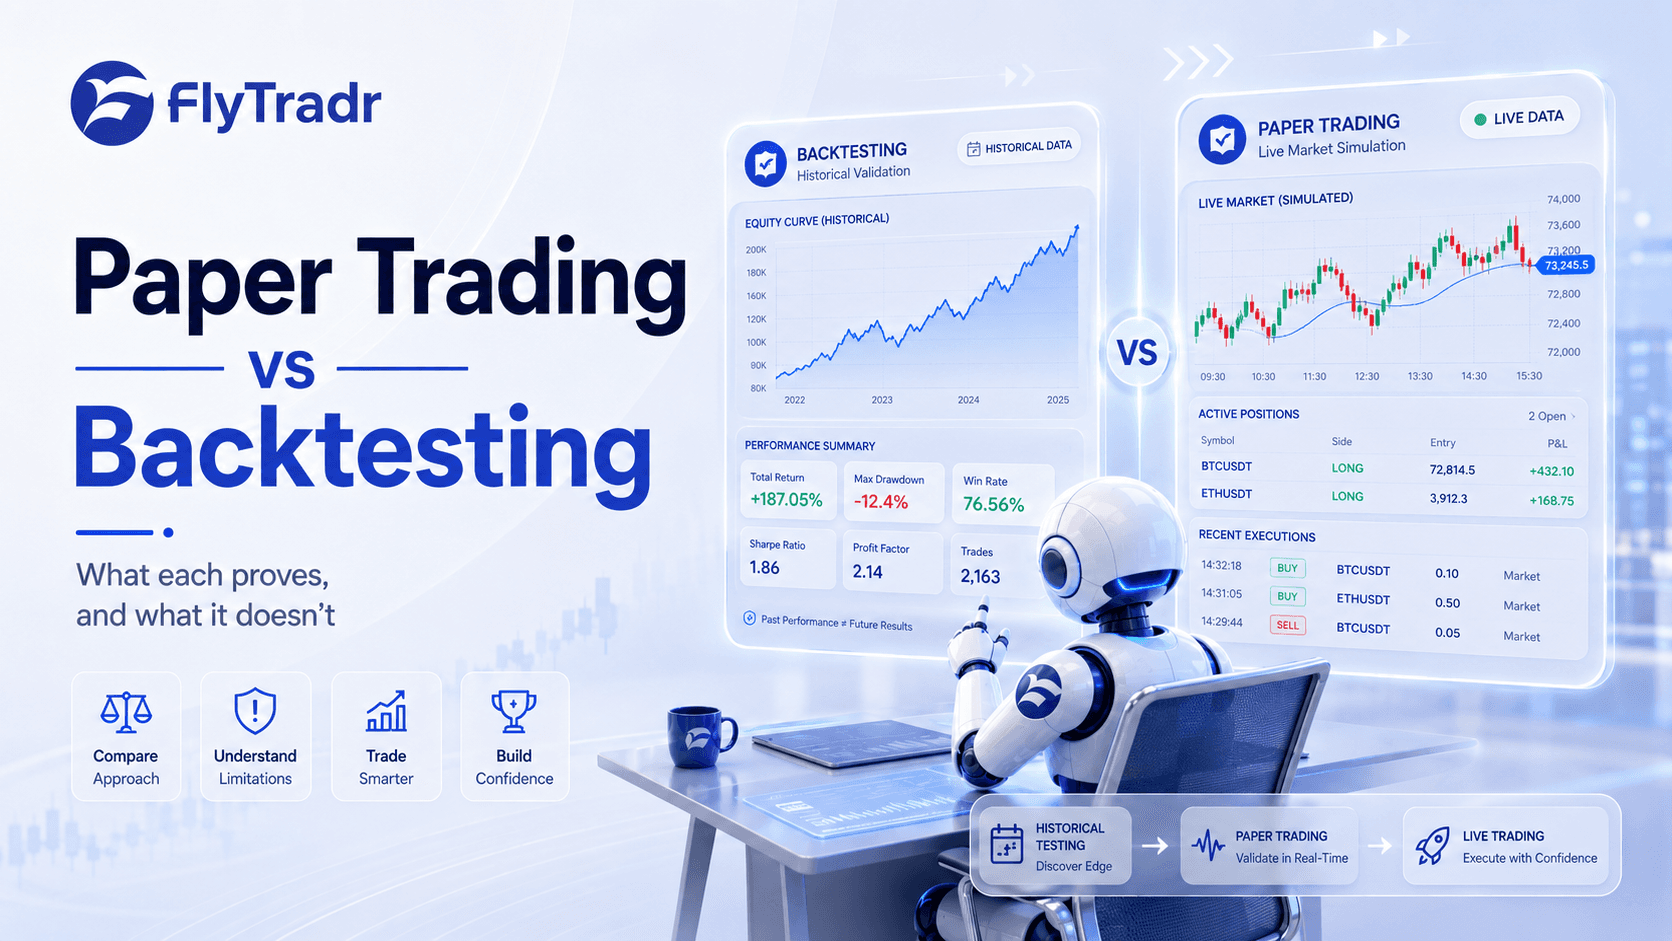
In this guide, we are going to break down exactly what mean reversion is, how it differs from trend following, and how to build a fully automated mean reversion strategy. I originally built FlyTradr because I couldn't find a seamless way to test my own trading ideas without writing custom code for every parameter tweak. Today, we’ll use it to automate a classic strategy without writing a single script.
What Is Mean Reversion?
At its core, mean reversion is a bet that price will return to its historical average after a sharp deviation.
Think of a rubber band. If you stretch it too far in one direction, the tension builds until it snaps back to the center. Price behaves similarly around established averages—not always, and not immediately, but consistently enough to build a statistical edge.
The "mean" usually refers to a moving average:
Simple Moving Average (SMA): The average price over a set number of periods.
Exponential Moving Average (EMA): A weighted average that reacts faster to recent price action.
Volume-Weighted Average Price (VWAP): The benchmark for intraday institutional execution.
One of the most reliable ways to trade this is by pairing a moving average with a momentum oscillator like the RSI. When the price falls below its average, and momentum confirms it is heavily oversold, the table is set for a bounce.
Mean Reversion vs. Trend Following
These are the two pillars of systematic trading, and they require completely different mindsets.
Trend following bets that a move already underway will continue. You buy strength and sell weakness. It prints money in trending markets but suffers the "death by a thousand cuts" when markets range sideways.
Mean reversion bets that a move is exhausted and will reverse. You buy weakness and sell strength. It thrives in ranging markets but will get crushed if you step in front of a relentless, runaway trend.
Neither is objectively better, and the best portfolios usually run both. However, for beginners, mean reversion has a distinct psychological advantage: it triggers more frequently and typically boasts a higher win rate. That makes it much easier to trust the system when you are evaluating your backtest data.
The Strategy Blueprint
For this walkthrough, we are building a straightforward RSI + SMA mean reversion system targeting Nifty 50 constituents.
Instrument: Any high-liquidity Nifty 50 stock (e.g., Reliance, HDFC Bank, Infosys).
Indicators: RSI (14-period) for momentum; SMA (20-period) for the baseline mean.
Entry Condition (Long Only): RSI drops below 30 AND price closes below the 20-day SMA. Both must occur simultaneously.
Exit Condition: RSI pushes above 50 OR price closes above the 20-day SMA.
Risk Management: Risk exactly 1% of account capital per trade, with a hard stop-loss 5% below the entry price.
Timeframe: Daily candles. This is an end-of-day (EOD) strategy, perfect if you are managing positions outside of active market hours.
Disclaimer: This strategy is for educational purposes to show you how to structure logic. Never commit capital without running your own historical backtests.
Building the Strategy on FlyTradr
Here is how to take that logic and turn it into an automated system.
Step 1: Open the Strategy Builder Log in, open the Strategy Builder, and name your system (e.g., "Nifty Daily RSI Snapback").
Step 2: Load the Indicators Add your RSI (14) to measure momentum and your SMA (20) to establish the mean.
Step 3: Lock in Entry Logic Under Entry Rules, set the logic operator to AND. Add: RSI(14) < 30 and Close < SMA(20).
Step 4: Define the Exits Under Exit Rules, set the logic operator to OR. Add: RSI(14) > 50 and Close > SMA(20).
Step 5: Automate Position Sizing Under Risk Management, set your risk-per-trade to 1% and your stop-loss to 5%. FlyTradr will dynamically calculate exactly how many shares you can afford to buy so your downside is strictly capped.
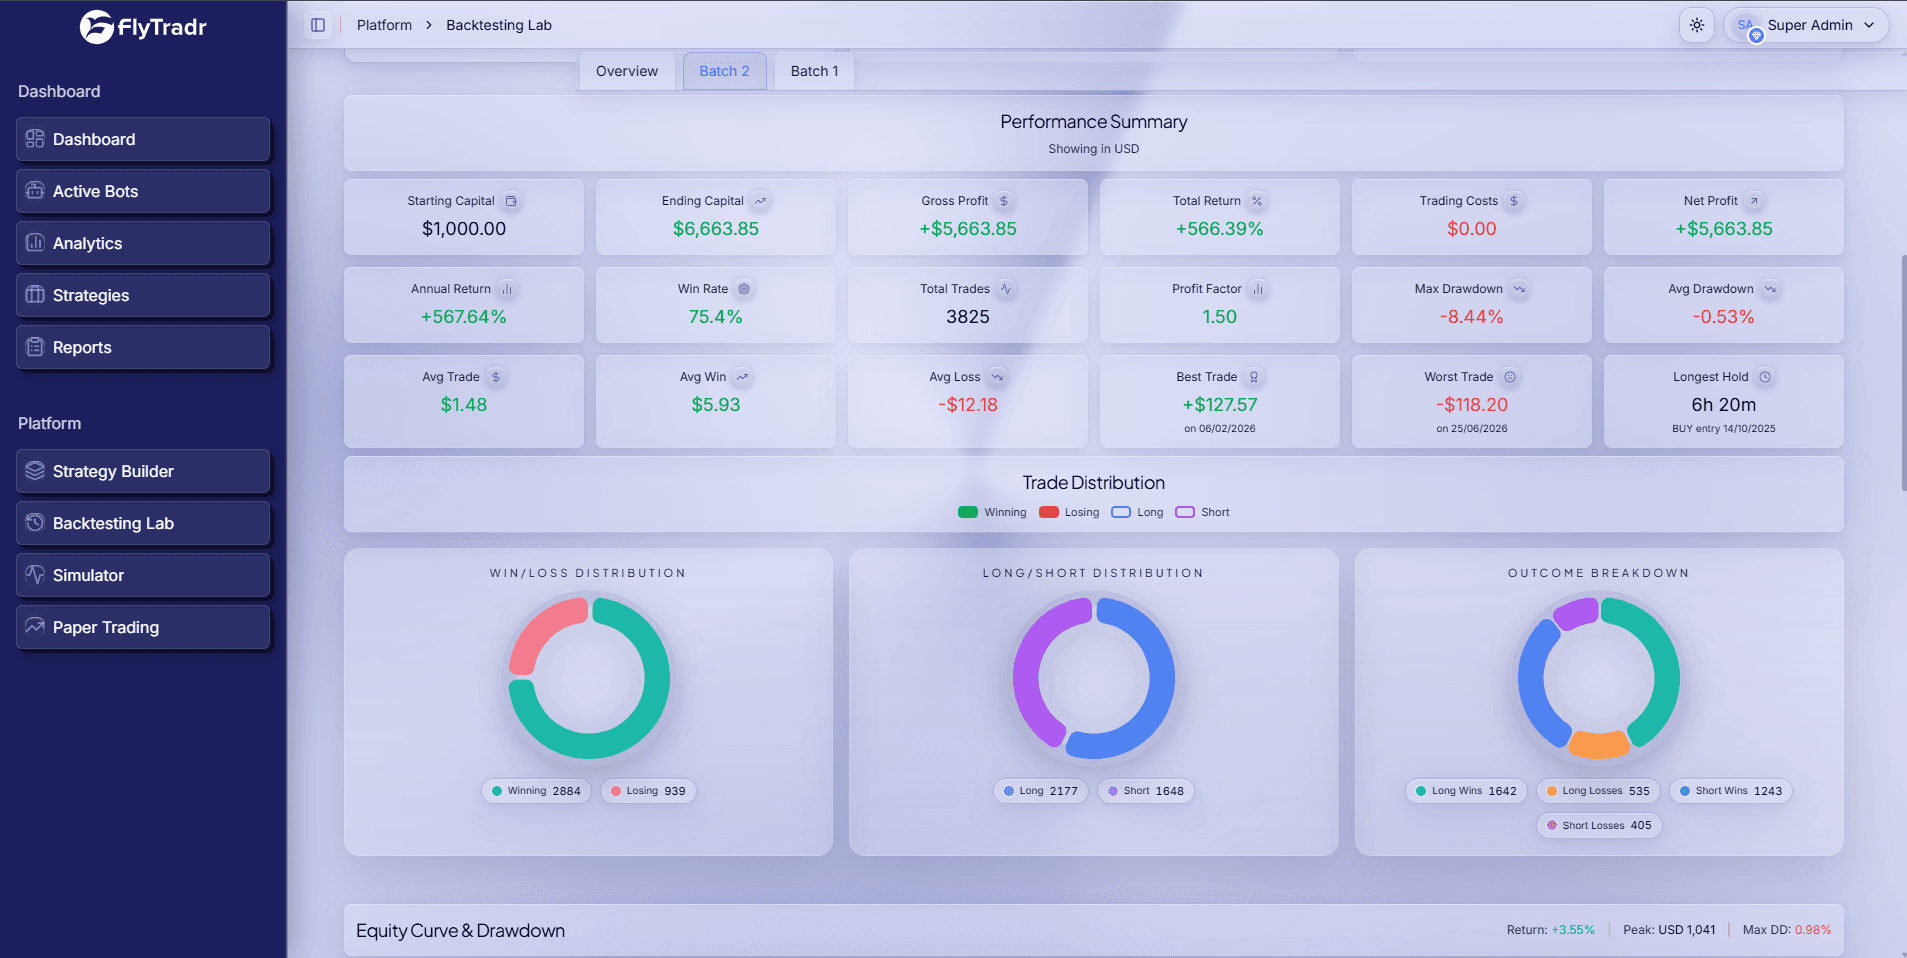
Step 6: Run the Lab Push this to the Backtesting Lab. Run it over at least 3–5 years of data. You are looking for a Sharpe ratio above 1.0 and a max drawdown you can actually stomach (ideally under 25%).

The Reality Check: Beware the Falling Knife
When you run the test, the win rate will likely look fantastic—often sitting between 60% and 70%. But a high win rate can hide a toxic strategy if your average loss is massive.
The Achilles' heel of mean reversion is the "falling knife." If a stock enters a structural downtrend, the RSI can stay below 30 for weeks. Your system will buy the dip, get stopped out, buy the next dip, and get stopped out again.
The Fix: Add a broad trend filter. Add a rule stating that the 50-day SMA must be sloping upward (SMA(50) today > SMA(50) 5 days ago). This ensures you are buying short-term dips in long-term uptrends, rather than catching falling knives in a bear market.
Next Steps
If your backtest graph looks like a steady staircase up, do not rush to connect your broker.
First, run a walk-forward test to ensure you haven't over-optimized the parameters. Next, deploy it in the Paper Trader for 30 days to verify that the live signals match your historical data. Only then should you go live, starting with 25% of your standard size.
Comments
Ask a question or leave feedback. Guests can post too.
Max 2000 characters.
No comments yet.
Quick answers
What is this article about?
Mean reversion is built on a simple idea: prices that move too far from their average tend to come back.
Who should read this article on Mean Reversion Trading: What It Is — and How to Build One Without Code?
This article is for retail traders who want a practical understanding of mean reversion trading: what it is — and how to build one without code before moving into backtesting, simulation, paper trading, or broker-connected execution.
What should I do after reading this article?
Use the article to clarify the concept first, then review FlyTradr workflow pages such as the algo trading platform overview, methodology and assumptions, or the FAQs page before making a platform decision.