
FlyTradr: No-Code Algorithmic Trading Platform for Retail Traders
Build, test, simulate, and automate trading strategies without coding.
Already using TradingView? Import supported Pine Script strategies into FlyTradr. Know more
No signup required.


Flow from Idea to Execution
A complete ecosystem designed to take you from strategy concept to live execution in minutes.

See Your Strategy's True Edge
Stop guessing. Start knowing. Our analytics dashboard gives you institutional-grade insights into your strategy's performance—from basic win rates to advanced Monte Carlo simulations.
Strategy Performance
Last 30 days
Everything You Need to Test Every Assumption
Hover over any feature to learn more. A complete ecosystem from idea to execution.
Tap any card to flip and see details
Already built in TradingView? Bring it into FlyTradr.
Import Pine Script strategies, customize the logic visually, backtest them, simulate them, and move toward deployment from one workflow instead of rebuilding everything by hand.
Import
Bring an existing TradingView Pine Script strategy into FlyTradr and get a clear review report for anything that needs attention.
Customize
Adjust indicators, conditions, and risk rules in the visual builder instead of rewriting the strategy from scratch.
Validate
Backtest the imported logic, simulate difficult market periods, and paper trade it before deciding whether it is ready for execution.
Deploy
Move from imported strategy to staged automation inside the same FlyTradr workflow when the strategy is ready.
Your Trading Universe
Every instrument your broker supports — crypto, equities, and more. One platform, no limits.
BTC
ETH
SOL
BNB
XRP
DOGE
ADA
AVAX
MATIC
DOT
LINK
UNI
AAPL
TSLA
NVDA
MSFT
AMZN
META
GOOGL
AMD
NFLX
COIN
PYPL
JPM
BAC
DIS
RELIANCE
TCS
HDFCBANK
INFY
WIPRO
ICICIBANK
BAJFINANCE
HCLTECH
TATAMOTORS
SBIN
SUNPHARMA
KOTAKBANK
MARUTI
LTIM
Showing a sample · thousands of instruments across Coinbase, Kraken, Binance, Robinhood, Interactive Brokers & more
Prices shown for illustrative purposes only
What early users are saying
Feedback from traders who tested the platform before public launch.
Rahul Sharma
Beta User“I was expecting the usual win rate and profit factor but you also get Sharpe ratio, max drawdown, average trade duration, losing streak count, all of it in one place. Most other tools make you export to a spreadsheet just to do that comparison.”
Arjun Mehta
Beta User“You pick your indicators, set the conditions, and the builder shows you what will trigger and when. Spent maybe 20 minutes on my first strategy. Took longer to figure out the right parameters but that is just trading.”
Kavya Reddy
Beta User“I found out through paper trading that my strategy was entering positions right before volatility spikes, which the backtest had not flagged clearly. I would not have caught that without seeing it run in real time.”
From the Blog
Platform updates, strategy research, and practical guides.

2026-06-19
By Reyaz
Replay Trading Simulator: How to practice execution without risking capital
Backtests show metrics. Simulators show behaviour. Learn how market replay helps you understand how strategies actually trade before you deploy them live.

2026-06-13
By Super Admin
Transaction Costs: Fees, Spreads, Latency—How to Approximate Them
Transaction costs can turn a profitable backtest into a losing strategy. Learn how to accurately model fees, spreads, slippage, and latency before you trade.
2026-06-11
By Reyaz
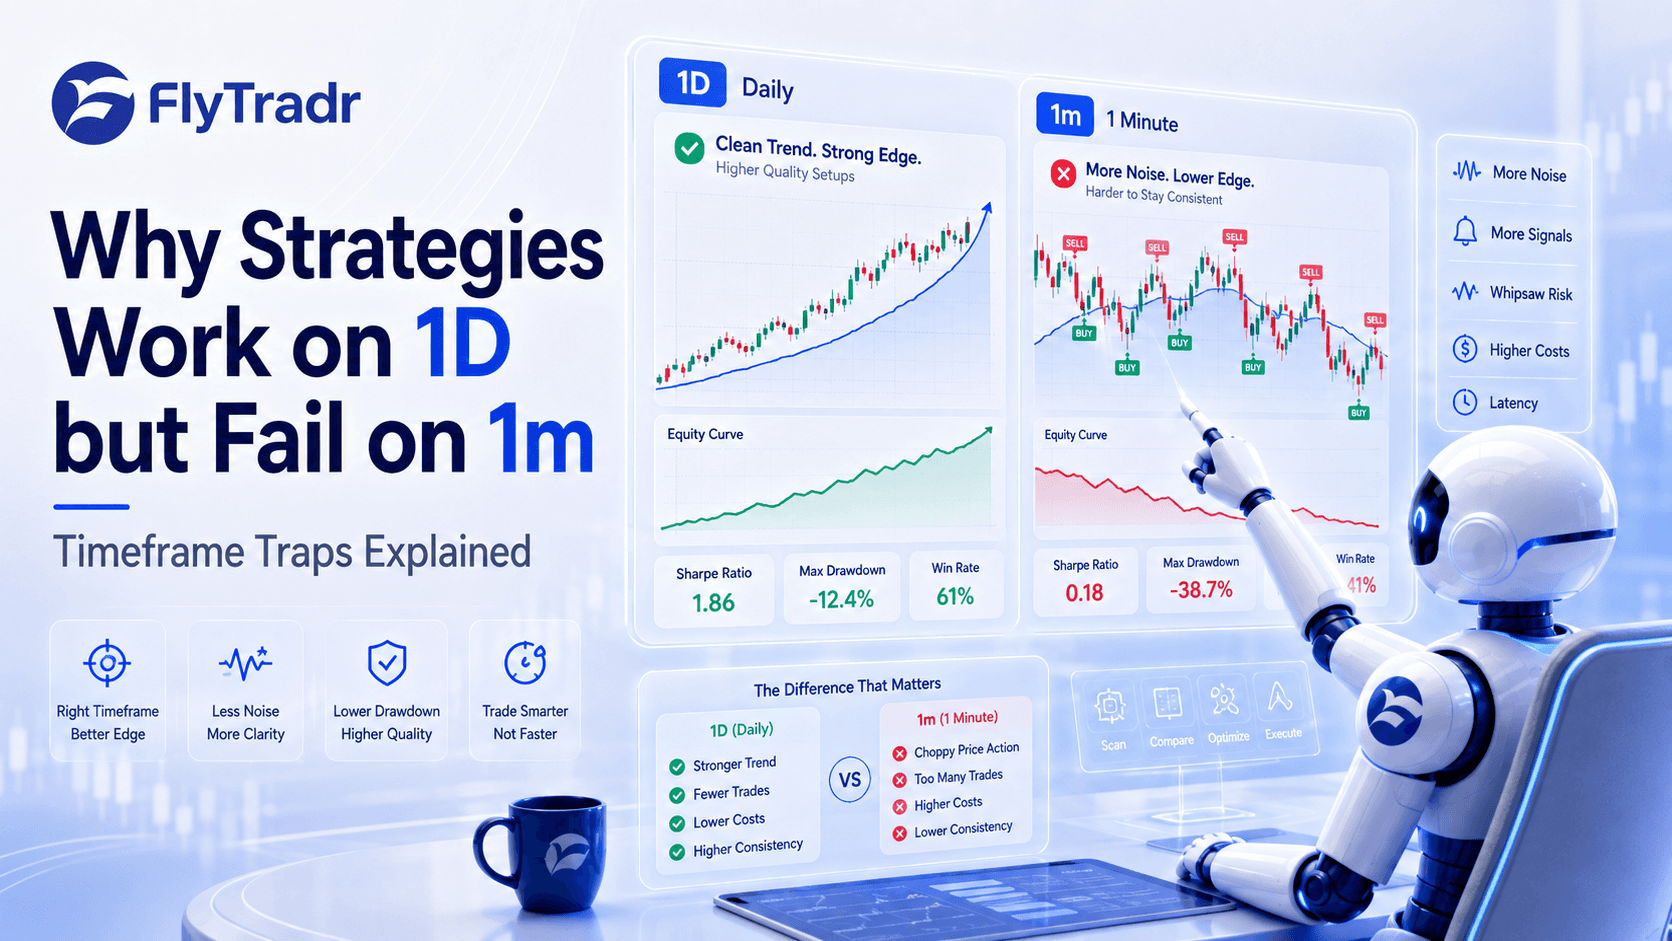
Why Strategies Work on 1D but Fail on 1m: Timeframe Traps Explained
Your strategy backtests beautifully on daily charts but collapses on 1-minute data. Learn why timeframe matters and how to avoid the most common timeframe traps.
Ready to Start Trading Smarter?
Start with a 30-day trial. No card required, no custody, and no withdrawal permissions.
Your first strategy is 5 minutes away.
No code. No broker required to start. Build and backtest for free — upgrade only when you're ready to go live.
30 days. No card required.
Frequently Asked Questions
Short, direct answers about what FlyTradr is, who it is for, and how the workflow works before live execution.
What is FlyTradr?
FlyTradr is a no-code algorithmic trading platform for retail traders. It helps you build rule-based strategies visually, backtest them on historical data, simulate execution, and paper trade before moving toward supported broker-connected workflows.
Does FlyTradr require coding?
No. FlyTradr is designed for traders who want to create and validate strategies without writing code. The workflow centers on visual strategy building and staged validation tools.
Is FlyTradr a broker?
No. FlyTradr is a software platform, not a broker or custodian. It does not hold your money. Where supported and configured, it connects your strategy workflow to your own brokerage account for execution.
Who is FlyTradr built for?
FlyTradr is built for retail traders who want a clearer path from strategy idea to tested execution. It fits traders who prefer to validate with backtesting, simulation, and paper trading before risking real capital.
What can you do with FlyTradr before live trading?
You can build a strategy, run historical backtests, replay market conditions in the simulator, and paper trade on live data with virtual capital. That staged workflow is designed to reduce guesswork before live execution.
Can FlyTradr import TradingView Pine Script strategies?
Yes. FlyTradr can import supported Pine Script strategy logic, convert it into editable builder rules, and then let you continue with backtesting, simulation, and paper trading inside the same workflow.
What if a Pine Script strategy is only partly supported?
FlyTradr shows a conversion report with warnings and unsupported items so you can review what translated cleanly and what still needs manual attention before relying on the strategy.