The Moving Average Crossover
Every trader has had the same thought at least once:
“I know my entry signal. I know when to exit. Why does it feel so different every time I actually trade it?”
The answer is almost always emotion.
You see a stock moving. You hesitate. You second-guess. By the time you act, the moment has passed — or worse, you act too late and buy the top.
This is exactly the problem algorithmic trading is built to solve.
And the moving average crossover is the perfect first strategy to understand why — because it’s simple, logical, and gives you a clear rule to follow instead of a feeling.
By the end of this post, you’ll understand how it works, see a real example, and know exactly how to build and test it yourself on FlyTradr — without writing a single line of code.
What Is a Moving Average?
Before getting into the strategy, it helps to understand the building block: the moving average (MA).
A moving average is simply the average closing price of an asset over a set number of past days. It “moves” because it updates continuously as new data comes in.
For example: If a stock closes at ₹1000, ₹1050, ₹980, ₹1020, and ₹1100 over 5 days, the 5-day moving average is ₹1030.
This smooths out noise. Individual days can be volatile due to news or sentiment. The moving average helps reveal the underlying trend.
The two most common types:
• Simple Moving Average (SMA): treats all data points equally • Exponential Moving Average (EMA): gives more weight to recent prices
For this strategy, either works. We’ll use SMA to keep it simple.
The Crossover Strategy: How It Works
The moving average crossover strategy uses two moving averages:
• A short-term (fast) MA • A long-term (slow) MA
The logic is straightforward:
• Buy signal: Fast MA crosses above Slow MA → momentum is shifting upward • Sell signal: Fast MA crosses below Slow MA → momentum is weakening
A single moving average tells you the trend.
Two moving averages tell you when the trend is changing.
A Real Example: 10-Day / 50-Day Crossover on Nifty 50
Consider a 10-day SMA (fast) and a 50-day SMA (slow).
Imagine the market has been moving sideways for weeks. The 10-day MA sits below the 50-day MA — no clear direction.
Then one day, the 10-day MA crosses above the 50-day MA.
That’s your signal.
You enter the trade based on a rule — not a feeling.
A few weeks later, the market weakens. The 10-day MA crosses below the 50-day MA.
That’s your exit.
Win or lose, you followed a consistent system.
That consistency is what allows you to evaluate and improve over time.
This is where backtesting becomes critical — running the strategy on historical data to measure performance objectively.
The Honest Part: Limitations
This strategy is useful, but not perfect.
• It’s lagging — signals come after the move has already started • It struggles in sideways markets — frequent false signals (whipsaws) • Parameter choice matters — 10/50 behaves very differently from 20/200
This doesn’t make it ineffective.
It makes it a tool.
The goal is not to find a perfect strategy, but one you can test, refine, and trust.
How to Build This on FlyTradr
Setting this up requires no code. The form-based strategy builder is divided into multiple sections like Basics, Indicators, Signals and Risk Management. Each section accepts inputs to specific to a specific part of the strategy and help organize the UI in better experience. Follow the steps mentioned below to build your custom strategy.
Open the Strategy Builder
Click on "Create New"
Give your strategy a custom name in "Strategy Name" area of the Basics section. Select the intent, Trade or Invest.
In Indicators section, Add a 10-period Simple Moving Average and a 50-period Simple Moving Average
Add your buy and sell signals in the Signals section based on the following logic
Buy Condition: Select the indicator 10 SMA in the left operand and 50 SMA in the right operand and crosses above in the comparator and finally select "Buy" in the action dropdown.
Sell Condition: Select the indicator 10 SMA in the left operand and 50 SMA in the right operand and crosses below in the comparator and finally select "Buy" in the action dropdown.
Next add desired risk manegement settings in the "Ris Management" area like Position Sizing, Stop Loss, Take Profit etc. if needed.
Next click on preview to validate the inputs, any errors or mandatory fields will be flagged here. If everything is good, strategy code in the form of DSL (Domain Specific Language) will be generated along with strategy synopsis in plain English for you to review and validate.
If everything looks good, click on "Save Strategy" and that's it. The strategy is ready for you to test and deploy.
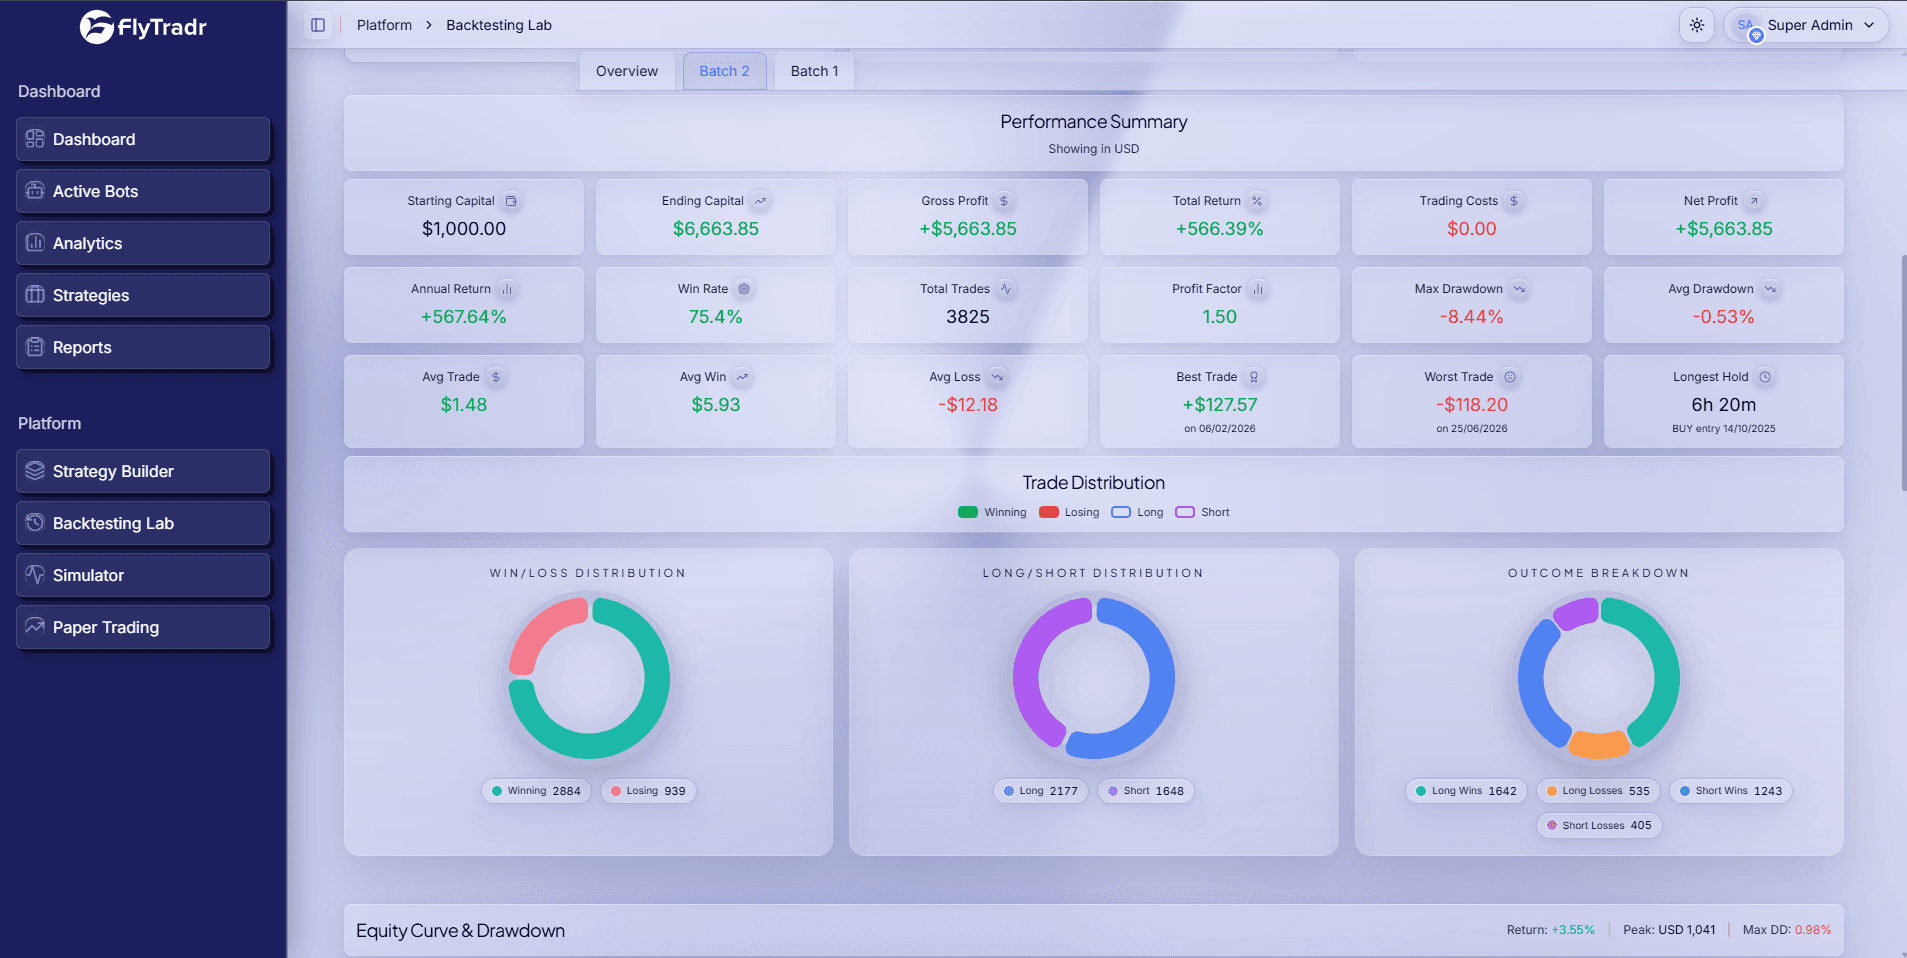
Go to the Backtesting lab and select the strategy you just created and run the backtest. Within minutes, you’ll have a full performance report — including win rate, returns, drawdown, and trade history.
What Actually Matters in Backtesting
Don’t focus only on returns.
Look at:
• Win rate — percentage of profitable trades • Risk/reward ratio — are winners larger than losers? • Maximum drawdown — how deep were losses? • Number of trades — is the sample size meaningful?
A strategy with moderate returns but controlled risk is often more sustainable.
Frequently Asked Questions
What is the best moving average crossover for beginners?
The 10/50 SMA crossover is a good starting point — simple and widely studied. You can later test variations like 20/100 or 50/200.
Does this work in Indian markets?
Yes. It’s commonly used across NSE stocks, indices, and even crypto markets. Always backtest on your specific asset.
Can this be used for crypto?
Yes. Crypto markets are often trend-driven, which suits crossover strategies. Shorter periods may work better.
How do you reduce false signals?
Add filters — for example, only take trades when price is above a long-term MA (like 200-day).
Do I need coding skills?
No. FlyTradr’s visual builder allows you to define strategies without writing code.
The Bottom Line
The moving average crossover is not a magic formula.
But it is one of the cleanest ways to understand algorithmic trading.
Define rules. Test them. Let the data speak.
Once you’ve built and tested this, you’ll have a framework you can apply to every strategy going forward.
The next step is simple:
Build it. Backtest it. See what the numbers say.
Try FlyTradr free — build and test your first strategy at flytradr.com
Comments
Ask a question or leave feedback. Guests can post too.
Max 2000 characters.
No comments yet.
Quick answers
What is this article about?
The moving average crossover is one of the oldest and most reliable patterns in trading — and it’s the perfect first algo strategy to build and test.
Who should read this article on The Moving Average Crossover: Your First Algo Trading Strategy (No Code Needed)?
This article is for retail traders who want a practical understanding of the moving average crossover: your first algo trading strategy (no code needed) before moving into backtesting, simulation, paper trading, or broker-connected execution.
What should I do after reading this article?
Use the article to clarify the concept first, then review FlyTradr workflow pages such as the algo trading platform overview, methodology and assumptions, or the FAQs page before making a platform decision.