What Is Drawdown? Why It Matters More Than Your Win Rate
Here’s a hard truth I’ve noticed with almost every trader transitioning to algo trading: they are addicted to Win Rate. It’s intuitive—we are conditioned to believe that a "B+" (80%) is better than a "D" (40%).
But in the world of quantitative finance, win rate is a "vanity metric." A strategy can win 80% of the time and still bankrupt you in a single afternoon. The number that actually determines whether you—and your account—survive? Drawdown.
By the end of this post, you’ll understand why drawdown is the ultimate gatekeeper of trading success and how to use it to build a strategy you won't abandon when things get tough.
What Is Drawdown, Exactly?
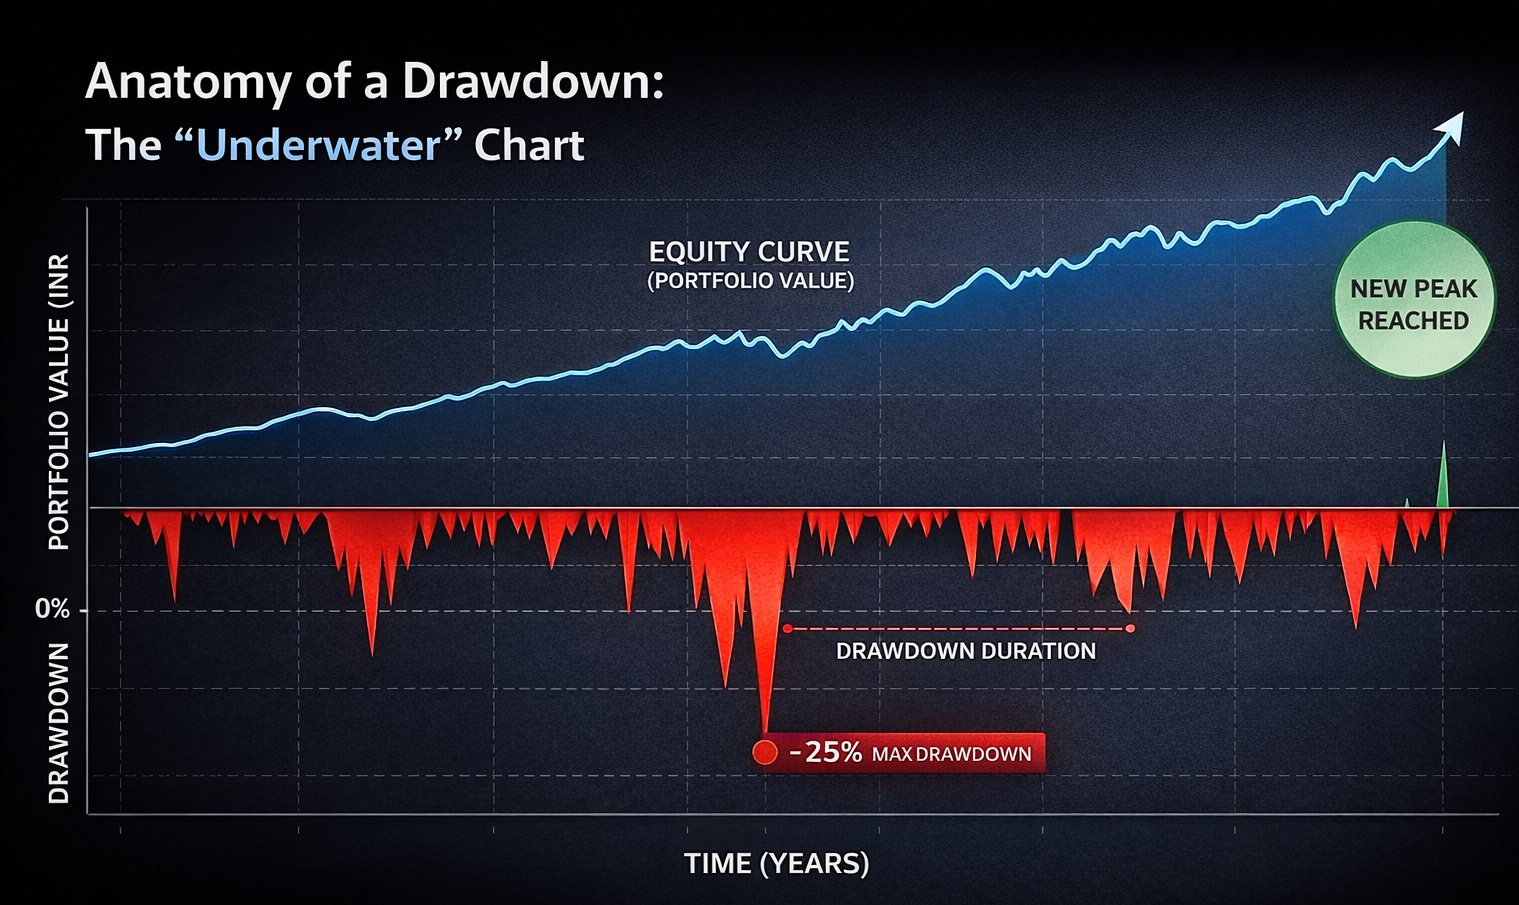
Drawdown is the peak-to-trough decline in your portfolio’s value. In plain English: it’s the "underwater" period. It measures the distance between your highest point of capital (the peak) and the lowest point (the trough) before a new high is reached.
The Math: If your portfolio grows to ₹1,00,000, then drops to ₹80,000, you are in a 20% drawdown. You remain in that drawdown until your equity crosses ₹1,00,000 again.
In algorithmic trading, we track two primary versions:
Maximum Drawdown (Max DD): The "Historical Worst Case." This is the deepest hole your strategy ever dug during a backtest.
Average Drawdown: The typical "turbulence" you should expect on a month-to-month basis.
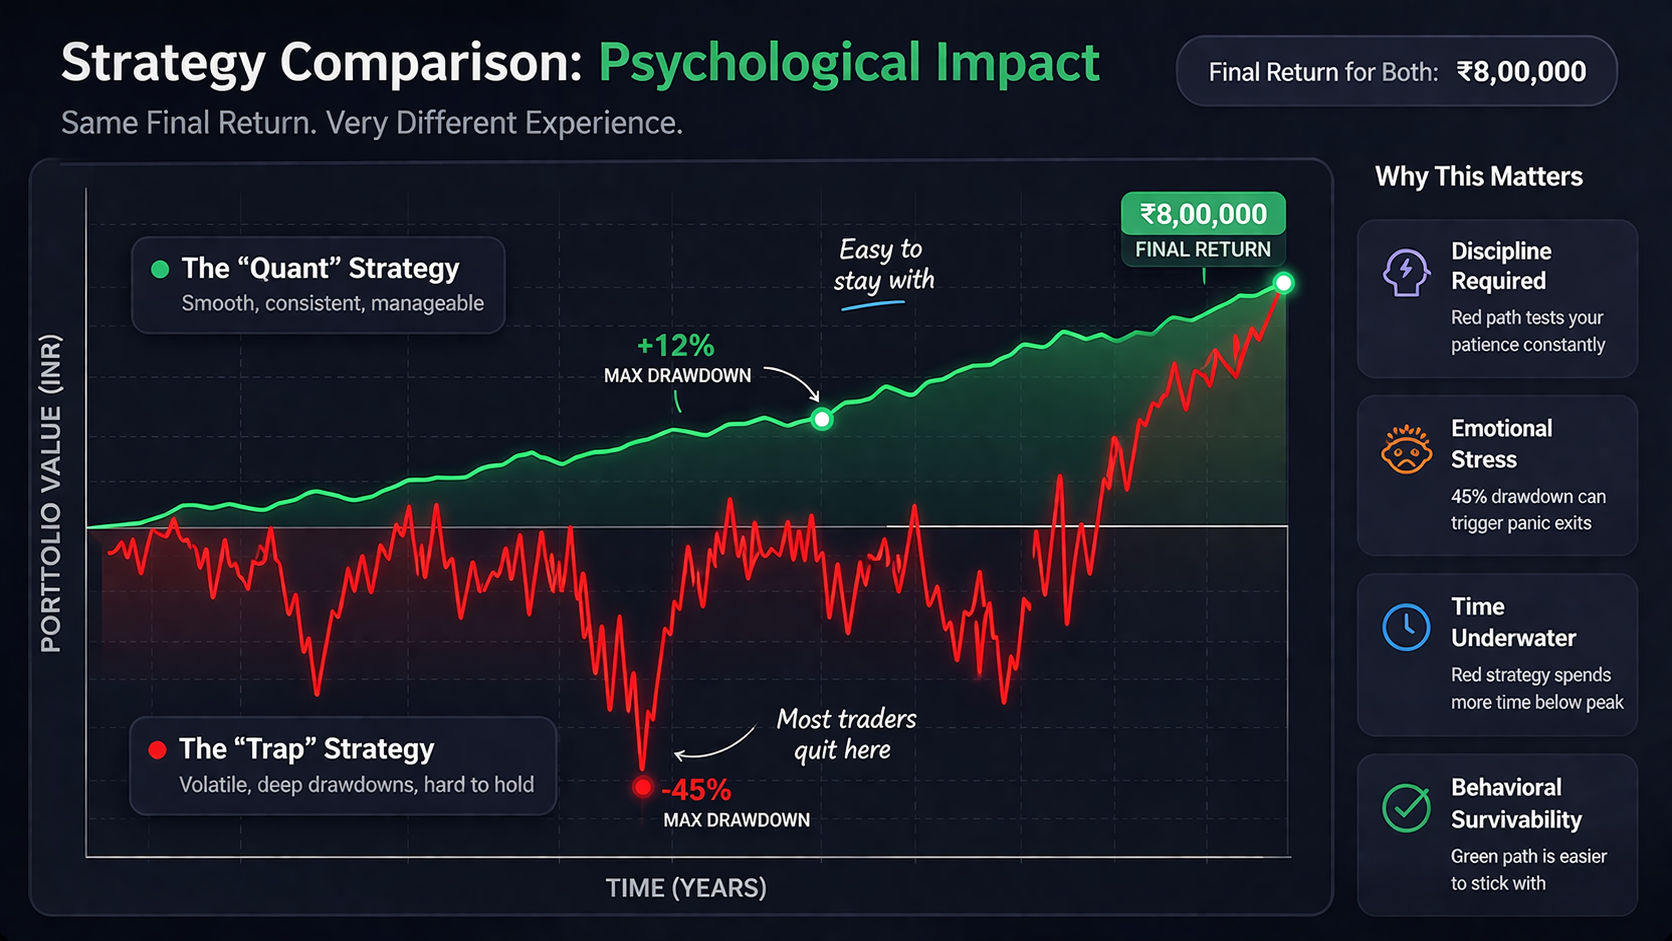
The Win Rate Trap: A Tale of Two Strategies
Let’s look at why win rate is misleading. According to a study by Tradeciety, many high-win-rate strategies fail because of "negative expectancy." Consider these two models tested on Nifty 50 data:
Metric | Strategy A (The "Trap") | Strategy B (The "Quant") |
Win Rate | 75% | 35% |
Avg. Win / Loss | ₹1,000 / ₹4,000 | ₹5,000 / ₹1,500 |
Max Drawdown | 45% | 12% |
Survival Odds | Low (One "Black Swan" kills it) | High (Built for the long haul) |
Strategy A feels better to trade—until it doesn't. Strategy B allows you to lose more often than you win while keeping your capital (and sanity) intact.
The "Uncle Point": Why Drawdown is Psychological
In industry circles, we talk about the "Uncle Point"—the specific dollar or percentage loss at which a trader yells "Uncle!" and shuts down the system.
Research in Behavioral Economics (Prospect Theory) shows that the pain of a loss is felt twice as strongly as the joy of an equivalent gain. If your backtest shows a 25% Max DD, you will feel like you are losing 50% of your emotional soul when it happens in real-time.
If you have ₹5,00,000 deployed and your Max DD is 40%, you must be prepared to watch ₹2,00,000 vanish on paper. If that number makes you nauseous, the strategy is a failure for you, regardless of its profit potential.
How to Evaluate Drawdown Like a Pro
When reviewing your FlyTradr backtests, look beyond the depth of the dip:
Recovery Factor: This is your Net Profit divided by Max DD. A ratio of 3 or higher is generally considered excellent. It tells you if the "pain" was worth the "gain."
Drawdown Duration: A 10% dip that lasts two days is easy. A 10% dip that grinds on for six months is a psychological nightmare. Look for "Time to Recovery."
The Ulcer Index: Developed by Peter Martin in 1987, this metric specifically measures the "stress" of a strategy by factoring in both the depth and duration of drawdowns.
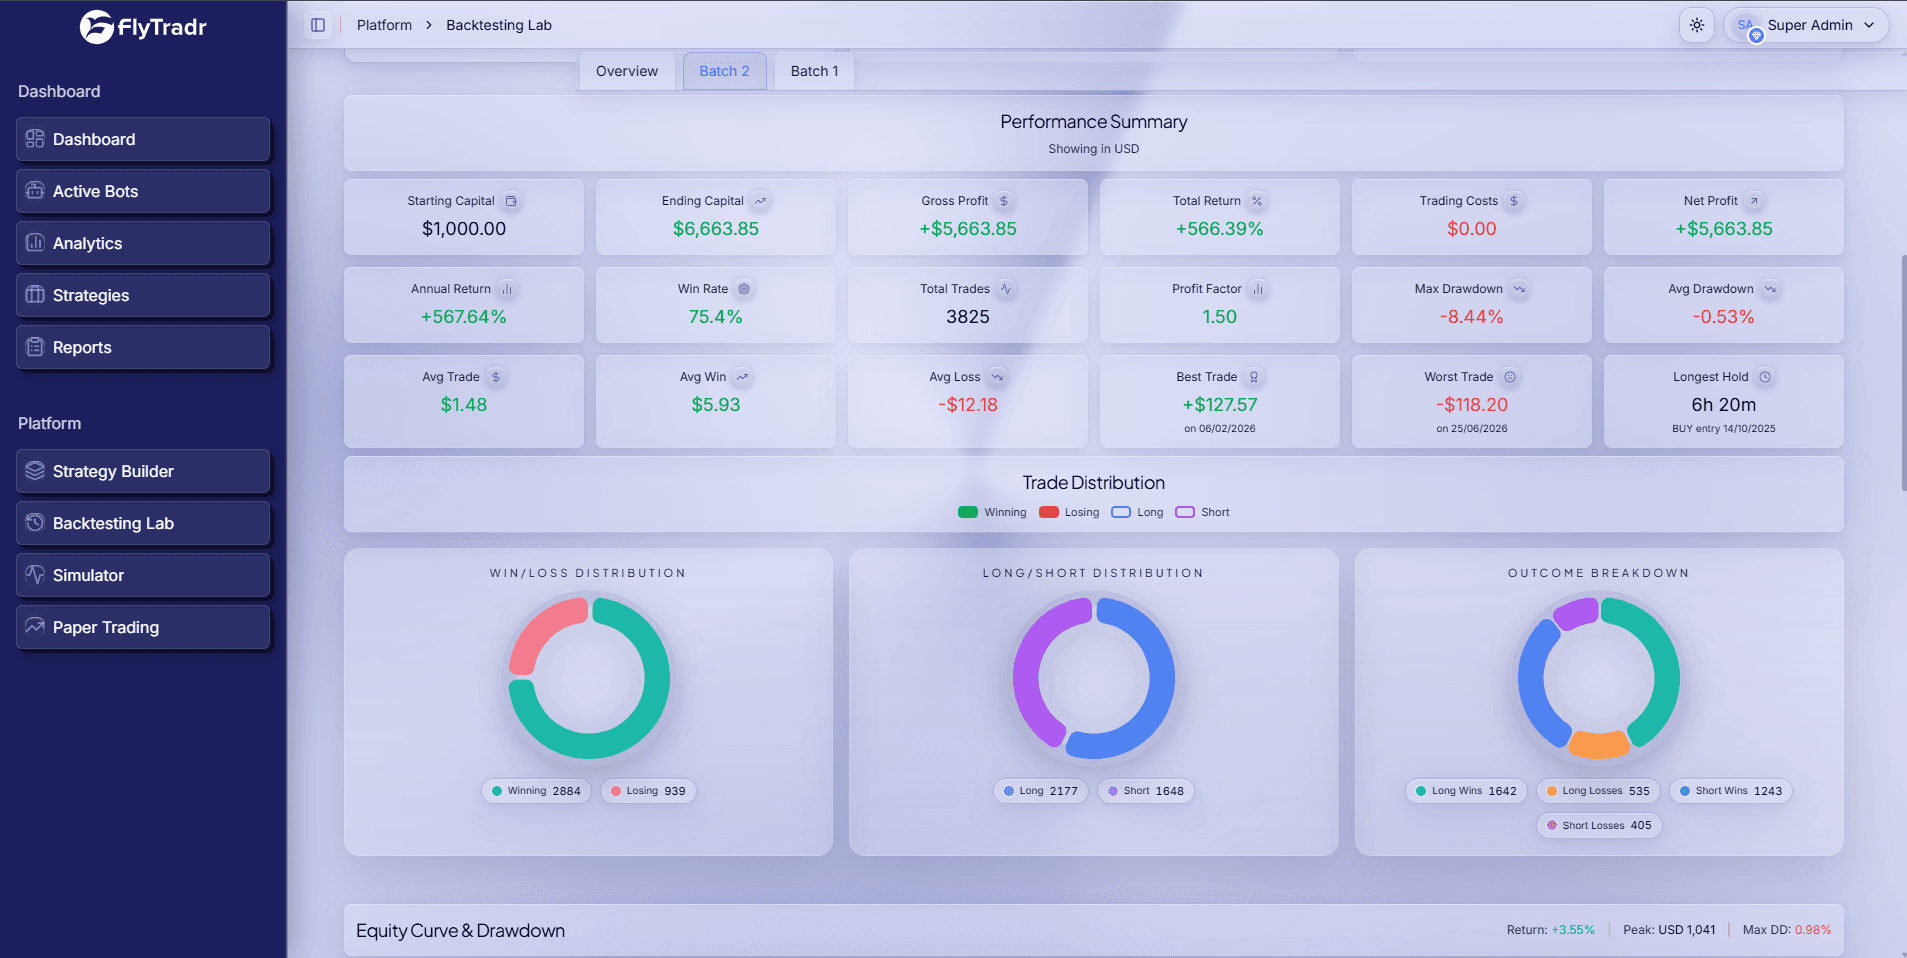
How FlyTradr Visualizes Your Risk
We believe you shouldn't need a PhD to understand your risk. When you run a backtest in the FlyTradr Lab, we visualize the "Equity Curve" alongside a "Drawdown Underwater Chart."
This allows you to see exactly where the strategy struggled—was it during the 2020 COVID crash? Or the sideways market of 2023? Seeing the shape of your risk helps you decide if you can stick with the script when the market turns red.
Comments
Ask a question or leave feedback. Guests can post too.
Max 2000 characters.
No comments yet.
Quick answers
What is this article about?
Most traders obsess over win rate.
Who should read this article on What Is Drawdown? Why It Matters More Than Your Win Rate?
This article is for retail traders who want a practical understanding of what is drawdown? why it matters more than your win rate before moving into backtesting, simulation, paper trading, or broker-connected execution.
What should I do after reading this article?
Use the article to clarify the concept first, then review FlyTradr workflow pages such as the algo trading platform overview, methodology and assumptions, or the FAQs page before making a platform decision.