

Bollinger Bands Mean Reversion: A Step-by-Step Strategy for Beginners
If you have read about mean reversion trading, you know the core idea: prices tend to return to an average over time, and you can try to profit from that tendency by buying when prices have moved unusually far below their average, and selling when they have moved unusually far above it.
Bollinger Bands are one of the most popular tools for identifying when a price has moved "unusually far." They do not just show you a moving average. They show you a moving average plus a measure of how volatile the price has been recently, which gives you a dynamic sense of what counts as an extreme move in the current environment.
This guide explains how Bollinger Bands work, how to use them as a mean reversion signal, and how to build a structured strategy around them.
What Bollinger Bands Actually Measure
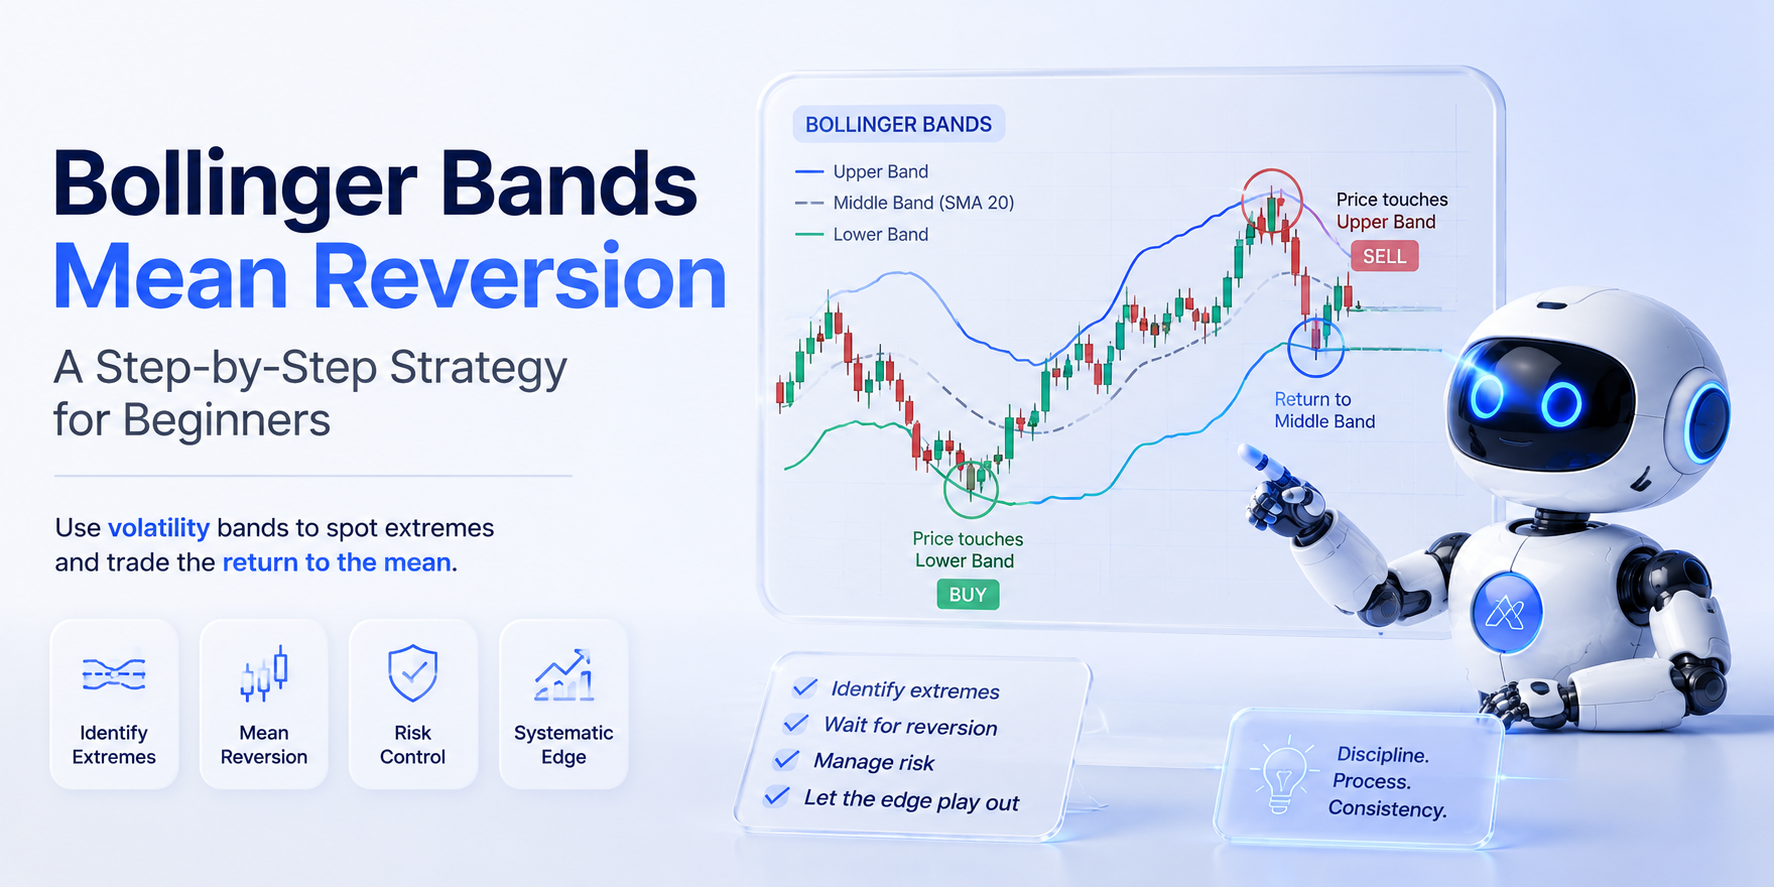
A Bollinger Band has three components: a middle band, an upper band, and a lower band.
The middle band is a simple moving average of the price, typically set to 20 periods. If you are looking at a daily chart, this is the 20-day moving average.
The upper band is the middle band plus two standard deviations of price over the same 20 periods. The lower band is the middle band minus two standard deviations.
Standard deviation is a measure of how spread out the price has been. When prices are moving a lot, the standard deviation is high, and the bands widen. When prices are quiet and moving in a narrow range, the standard deviation is low, and the bands narrow.
This is what makes Bollinger Bands more useful than a fixed percentage band or a simple moving average channel. They adapt to the current volatility of the market. A move that would touch the upper band during a calm period might not even get close during a volatile one.
The statistical implication: approximately 95% of price closes should fall inside the bands, assuming normal distribution. When price closes outside a band, it is in the 5% tail. That is the event you are trying to trade.
The Mean Reversion Signal
In a mean reversion framework, you are looking for two things.
First, a price close outside or near the lower band. This signals that the price has moved significantly below its recent average, which is your trigger to look for a long entry.
Second, a return toward the middle band. This is your target. You are not trying to predict a major rally. You are simply looking for the price to return to its average after an extreme move.
The same logic applies in reverse for short trades: a close near or outside the upper band, with a target return to the middle band.
Building a Basic Bollinger Band Mean Reversion Strategy
Here is a concrete set of rules for a long-only mean reversion strategy.
Entry condition: the closing price touches or crosses below the lower Bollinger Band. This is your signal that price has moved into an extreme low.
Confirmation: optionally, require that the RSI is below 40 at the same time. This adds a second filter to confirm that momentum is weak, not just that price is at the lower band.
Entry execution: buy at the open of the next candle after the signal.
Exit condition: the closing price crosses above the middle band (the 20-period moving average). This is your mean reversion target.
Stop loss: place a stop loss below the recent swing low, or use a fixed percentage stop such as 3% below your entry price.
This is a starting framework, not a finished strategy. Real performance depends on the specific market you apply it to, the timeframe you use, and how strict you are about your filters.
What Makes This Strategy Work and When It Fails
Mean reversion strategies perform well in ranging or oscillating markets, where prices repeatedly move away from and back toward their average. They perform poorly in strongly trending markets.
If a stock is in a steady downtrend, closing below the lower Bollinger Band can be a continuation signal rather than a reversal signal. The price touches the lower band, you buy expecting a mean reversion, and instead the price continues lower.
This is why many traders add a trend filter to mean reversion strategies. A simple approach is to require that the price is still above its 200-day moving average before taking a mean reversion signal on the lower band. This filters out entries during significant downtrends.
Another failure mode is the band squeeze. When Bollinger Bands narrow significantly, it often precedes a breakout in either direction. Mean reversion logic can be less reliable during squeeze conditions because the low volatility environment that created the squeeze may be about to end with a large directional move.
Backtesting This Strategy Before Trading It
Before you put any real money on a Bollinger Band mean reversion strategy, you need to test it on historical data. The backtest will tell you how this strategy would have performed on the specific instrument and timeframe you are considering.
Key metrics to look at in your backtest results:
Win rate and average win versus average loss. A mean reversion strategy typically has a higher win rate than a trend-following strategy, but the average losing trade can be larger than the average winning trade. You need to understand this ratio before going live.
Maximum drawdown. What is the worst period this strategy went through? Can you psychologically and financially tolerate a similar drawdown in live trading?
Number of trades. A strategy that generates 400 trades in a backtest gives you statistically more reliable results than one that generates 20. A very small sample of trades makes it difficult to judge whether the results are real or just luck.
If you are building this on FlyTradr, you can set up the Bollinger Band conditions in the no-code Strategy Builder, run the backtest in the Backtesting Lab, and review all of these metrics in one place before committing to paper or live trading.
Timeframe and Instrument Considerations
Bollinger Band mean reversion strategies can work across multiple timeframes, but the dynamics change.
On daily charts, you are typically holding a position for several days to a few weeks while waiting for the price to return to the middle band. This suits traders who are comfortable with overnight exposure.
On shorter intraday timeframes such as 15-minute or 1-hour charts, the signals are more frequent but also noisier. False signals are more common intraday because random price movement within a session can push prices outside the bands without any fundamental reason for the move.
For Indian equity markets, applying this strategy to Nifty 50 constituent stocks on daily charts tends to give cleaner results than applying it to smaller midcap stocks, where lower liquidity creates more erratic band interactions.
Adjusting the Parameters
The default settings of 20 periods and two standard deviations are not fixed rules. They are starting points.
A shorter period such as 10 produces more responsive bands that will generate more signals, but with more noise. A longer period such as 50 produces smoother bands with fewer but potentially cleaner signals.
Changing the standard deviation multiplier to 2.5 or three standard deviations makes the bands wider and reduces the number of times price touches the band. When it does touch, the extreme is more significant, which can improve the quality of individual signals at the cost of fewer total signals.
Experimenting with these parameters through backtesting rather than live trading is the right approach.
A Realistic Expectation for Bollinger Band Mean Reversion
This strategy will not win on every trade. A realistic win rate for a simple mean reversion strategy is somewhere in the range of 55 to 65 percent, depending on the market and conditions. That means losing on 35 to 45 percent of trades.
What makes the strategy work over time is the combination of a reasonable win rate, controlled losses through proper stop placement, and letting winners run to the target rather than exiting early out of impatience.
The discipline to follow the rules consistently is more important than finding the perfect parameter set. A simple strategy followed consistently will outperform a more sophisticated strategy traded impulsively.
FlyTradr's no-code Strategy Builder lets you implement Bollinger Band conditions without writing any code. You can set up this exact entry and exit logic, run a backtest against historical data, and review your results before committing to paper or live trading. Explore the Strategy Builder here.
Comments
Ask a question or leave feedback. Guests can post too.
Max 2000 characters.
No comments yet.
Quick answers
What is this article about?
Bollinger Bands are one of the most useful tools for mean reversion trading.
Who should read this article on Bollinger Bands Mean Reversion: A Step-by-Step Strategy for Beginners?
This article is for retail traders who want a practical understanding of bollinger bands mean reversion: a step-by-step strategy for beginners before moving into backtesting, simulation, paper trading, or broker-connected execution.
What should I do after reading this article?
Use the article to clarify the concept first, then review FlyTradr workflow pages such as the algo trading platform overview, methodology and assumptions, or the FAQs page before making a platform decision.