

Backtesting Slippage, Why Profitable Strategies Can Fail Live
A strategy can look profitable in a backtest and still struggle when it is traded live.
This does not always mean the strategy logic was useless. Sometimes the problem is much more practical. The backtest assumed that every trade entered and exited at the expected price, while live trading gave slightly worse fills, wider spreads, partial fills, delayed execution, or missed orders.
That difference is called slippage.
Slippage is easy to ignore because it often looks small on a single trade. A few paise, cents, ticks, or basis points may not feel important when reviewing one entry. But strategies do not usually fail because of one small cost. They fail because the same small cost appears again and again across many trades.
This is especially important for algorithmic strategies. When a system trades frequently, even a small gap between expected price and actual fill price can change the entire performance profile.
In this guide, we will look at what slippage means, why it affects backtests, how it becomes more serious as trade frequency increases, and how to test whether a strategy still makes sense after realistic execution costs.
What Slippage Means
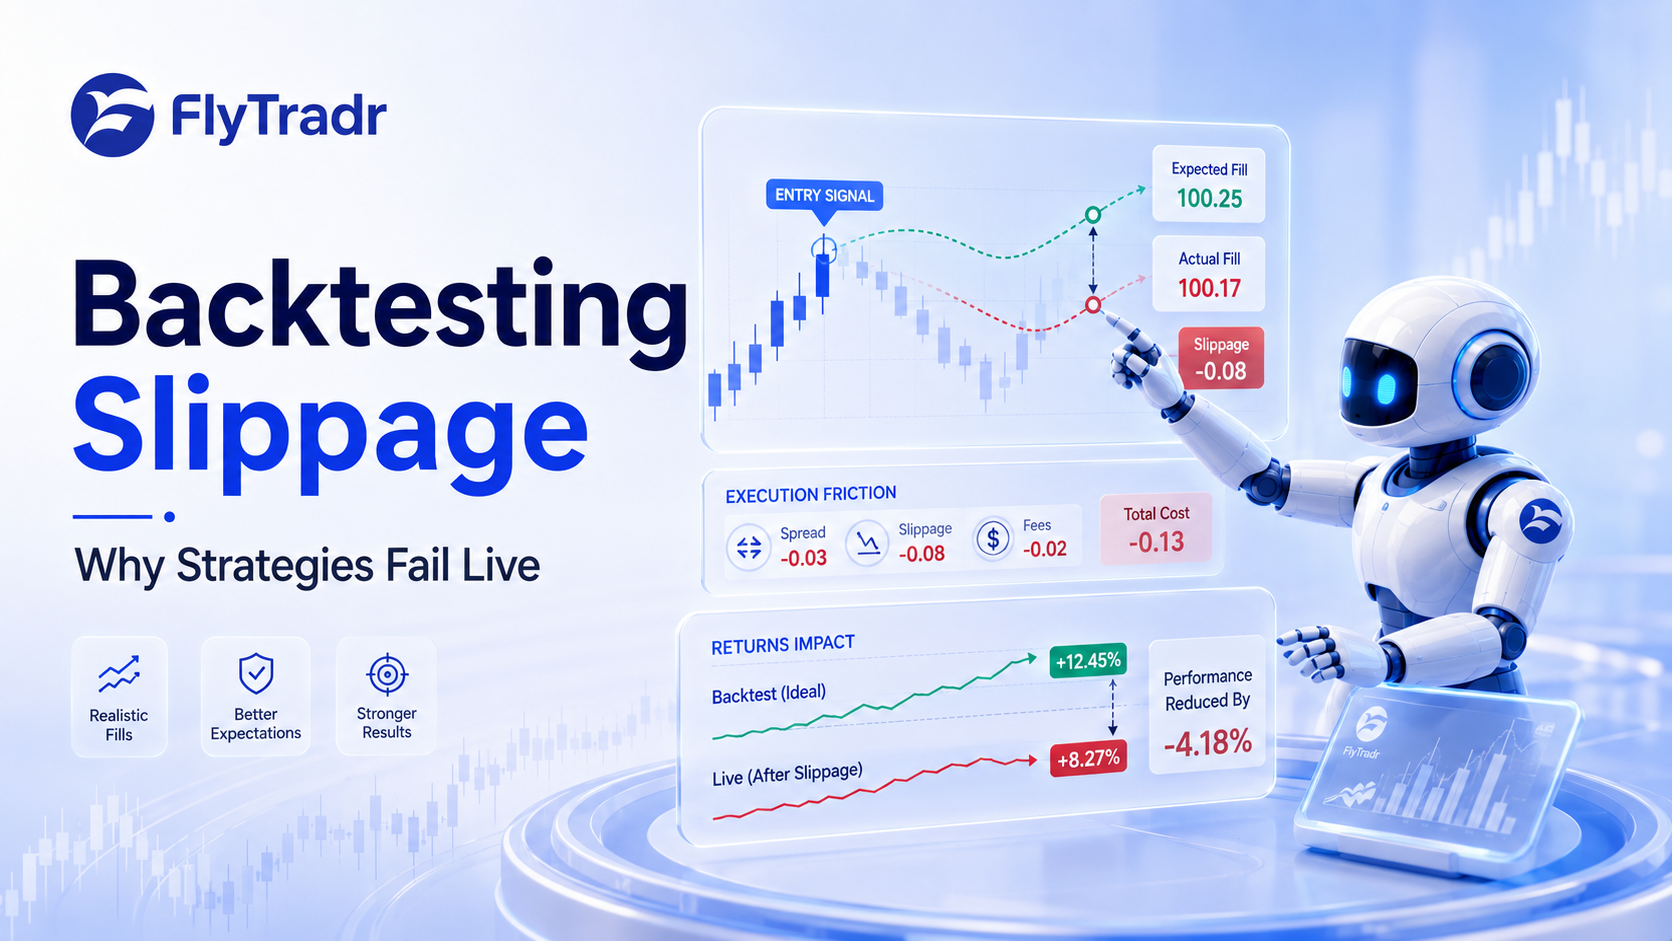
Slippage is the difference between the price your strategy expects and the price at which the trade actually executes.
Suppose a strategy generates a buy signal when an instrument is shown at 450.00. The order is sent to the market, but by the time it is filled, the actual entry price is 450.12. That 0.12 difference is slippage.
The same thing can happen on the exit. If the strategy expected to sell at 455.00 but the actual fill happened at 454.88, the trade lost another 0.12 compared with the backtest assumption.
In a backtest, this difference may not appear unless the model explicitly accounts for it. The backtest may simply assume that the strategy bought and sold at the exact prices shown in the data.
Live markets are not that clean.
There is a bid price, an ask price, available liquidity, order queue priority, latency, volatility, broker routing, and the possibility that the market moves while the order is being submitted. Slippage is where all of those frictions start showing up in the final result.
Why Slippage Matters More Than It First Appears
Slippage rarely looks dramatic when viewed one trade at a time.
If the expected entry is 450.00 and the actual entry is 450.05, it may not look like a serious issue. But if the strategy trades hundreds or thousands of times, the small difference can become large enough to turn a strong backtest into an ordinary one, or an ordinary backtest into a losing strategy.
This is why slippage should always be viewed together with trade frequency and average trade size.
A strategy that makes a small average profit per trade is far more sensitive to slippage than a strategy that aims for larger moves. A scalping or short term momentum strategy may depend on very precise execution. A longer term swing strategy may be less affected because the expected move is larger relative to the execution gap.
The question is not only, how much slippage did I assume.
The better question is, does the strategy have enough edge per trade to survive the slippage it is likely to experience.
The Cost Multiplier, Trade Frequency
The more often a strategy trades, the more important execution costs become.
Here is a simple example.
Strategy Type | Trades Per Year | Average Slippage Cost Per Round Trip | Estimated Annual Slippage Cost |
|---|---|---|---|
Long term swing strategy | 20 | 5 dollars | 100 dollars |
Short term strategy | 200 | 5 dollars | 1,000 dollars |
Very active strategy | 2,000 | 5 dollars | 10,000 dollars |
The slippage per trade did not change. Only the number of trades changed.
This is why high activity strategies need much more careful execution testing. They can look excellent when modelled with perfect fills, but the live version has to pay the cost of every entry and exit.
If the average trade is large, the strategy may absorb that cost. If the average trade is small, slippage can become the difference between a strategy that looks profitable and a strategy that is not worth trading.
Where Slippage Comes From
Slippage is not one single thing. It can come from several different sources, and each one matters differently depending on the strategy.
Spread Cost
The spread is the gap between the bid price and the ask price.
If you buy immediately with a market order, you are usually paying the ask. If you sell immediately, you are usually hitting the bid. That difference creates a cost even before additional market movement is considered.
Highly liquid instruments usually have tighter spreads. Less liquid instruments, far dated options, small caps, and thin markets can have wider spreads. Wider spreads make it harder for a strategy to match ideal backtest prices.
Price Movement During Execution
Markets move while orders are being sent and processed.
For slow strategies, this may not matter much. For strategies that react to breakouts, news, sudden momentum, or fast intraday movement, the price can move meaningfully between signal generation and order execution.
This is one reason momentum systems can be more sensitive to slippage. The signal often appears when price is already moving, and by the time the order reaches the market, the entry may be worse than the backtest assumed.
Market Impact
Market impact happens when the order itself affects the price.
For small orders in highly liquid instruments, this may be minimal. For larger orders, less liquid instruments, or thin order books, the order can consume available liquidity and push the fill price against the trader.
This is also why position size matters. A strategy may work with small paper trading size but behave differently when scaled up.
Partial Fills And Missed Orders
Backtests often assume that an order is either filled fully or not at all. Live execution can be messier.
A limit order may be partially filled. A market may touch the intended level but not provide enough liquidity. A price may move away before the full order is completed. If the strategy assumes a full position but only part of the order executes, the live result can diverge from the backtest.
For automated strategies, partial fills are not just a performance issue. They can also create position tracking and risk management issues if they are not handled correctly.
Market Orders And Limit Orders Behave Differently
The way a strategy sends orders has a major impact on slippage.
A market order prioritises execution. It is designed to get filled quickly, but the final price may be worse than expected. This can be useful when missing the trade is more costly than accepting some slippage, but it needs to be modelled honestly.
A limit order prioritises price. It says the strategy is only willing to trade at a certain price or better. This can reduce negative slippage, but it introduces another risk. The order may not fill at all.
That means limit orders are not a free solution. A backtest that assumes every touched limit order is filled may still be too optimistic. In live markets, price can touch a level without enough available quantity to fill the order, or the trader may be behind other orders in the queue.
A realistic backtest should match the intended execution style. Market order strategies should model worse fills. Limit order strategies should account for missed or partial fills where possible.
Why Slippage Changes Across Market Conditions
Slippage is not constant.
It can be low during calm periods and much higher during volatile periods. It can widen around earnings releases, economic announcements, sudden news, low liquidity sessions, market opens, market closes, and fast directional moves.
This creates a common backtesting problem. A strategy may assume the same fixed slippage on every trade, but live execution may be worst exactly when the strategy is most active.
For example, a breakout strategy may trigger during a fast move. That is also when spreads can widen and market orders may fill worse than expected. A mean reversion strategy may place limit orders, but during sharp moves those orders may fill only in the trades that continue moving against the position.
This is why it is useful to test more than one slippage assumption. A single average cost can hide the fact that some market periods are much harder to execute than others.
How To Model Slippage In A Backtest
There is no perfect slippage model, but even a simple model is usually better than assuming perfect execution.
A practical approach is to test multiple assumptions.
Fixed Slippage
Fixed slippage applies the same cost to every trade.
For example, the backtest may assume that each entry and exit is filled slightly worse than the displayed price. This is simple, easy to understand, and useful as a starting point.
The limitation is that it treats every instrument and market condition the same.
Percentage Based Slippage
Percentage based slippage applies a cost as a percentage of price.
This can make more sense when comparing instruments with very different prices. A fixed amount may be too large for one instrument and too small for another.
The limitation is that price alone does not capture liquidity or spread.
Spread Based Slippage
Spread based modelling attempts to separate bid and ask prices, or at least estimate the cost of crossing the spread.
This is more realistic for strategies that use market orders, because buying and selling are not usually done at the same midpoint price.
Scenario Testing
The most useful approach is often to run several versions of the backtest.
One version can use low cost assumptions.
One can use realistic assumptions.
One can use pessimistic assumptions.
If the strategy only works in the optimistic version, the result should be treated carefully. If it remains acceptable across several cost assumptions, it may deserve further validation.
A Simple Example
Imagine a strategy that takes 200 trades in a year and shows an average gross profit of 10 dollars per trade before costs.
At first, that sounds positive. But the average trade is not large. It does not leave much room for friction.
Now assume the round trip cost from spread, slippage, and fees is 4 dollars per trade. The average net trade falls from 10 dollars to 6 dollars.
If the round trip cost is 8 dollars, the average net trade falls to 2 dollars.
If the actual cost is 11 dollars, the strategy becomes negative even though the backtest looked profitable before costs.
This is why average trade matters. A strategy with a small average trade must be tested very carefully against realistic execution costs.
How To Reduce Slippage In Live Trading
The first step is to model slippage honestly. The second step is to design execution rules that reduce avoidable friction.
One approach is to trade more liquid instruments. Tighter spreads and deeper order books usually make execution more predictable.
Another approach is to avoid periods where spreads are known to widen unless the strategy is specifically designed for those conditions. Market opens, major announcements, and sudden news driven moves can all produce worse fills.
Order type also matters. Limit orders can help control price, but they may miss trades. Market orders can improve fill probability, but they may slip. The right choice depends on the strategy. A mean reversion strategy may tolerate patient limit orders. A momentum strategy may prefer faster execution but needs a larger edge to absorb slippage.
Position size should also be reviewed. A strategy that looks fine at a small size may experience more market impact when scaled up. Gradual scaling can help reveal whether execution quality changes as size increases.
How FlyTradr Fits This Workflow
Slippage should not be added at the end as an afterthought. It should be part of the strategy testing process from the beginning.
In the FlyTradr Backtesting Lab, traders can compare how a strategy behaves under different assumptions and review whether performance still makes sense after execution friction is considered.
The FlyTradr Simulator can help users replay market periods and observe where execution assumptions may matter most. A static result summary is useful, but watching how a strategy behaves during fast or choppy conditions can reveal risks that a single number does not show.
Before live deployment, the strategy should also be observed through the FlyTradr Paper Trader. Paper trading will not perfectly reproduce live execution, but it can help identify differences in signal timing, trade frequency, order behaviour, and operational workflow.
If the strategy eventually moves toward live deployment, broker connection and live management happen through the FlyTradr Dashboard. At that stage, position size should usually start small until the live fills, costs, and behaviour are understood.
What To Check Before Trusting A Backtest
Before trusting a strategy result, ask these questions.
Did the backtest include spread, slippage, and fees.
Is the average trade large enough to survive realistic costs.
Does the strategy still work under pessimistic cost assumptions.
Does performance depend heavily on frequent trading.
Are limit order fills modelled realistically.
Does the strategy trade during volatile or illiquid periods.
Has the strategy been tested on paper before live deployment.
Does performance remain acceptable after execution friction.
These questions are not meant to make strategy testing harder for the sake of it. They are meant to prevent avoidable surprises.
The Bottom Line
Slippage is not a small detail. It is one of the main reasons a strategy can look profitable in a backtest and disappoint in live trading.
The more frequently a strategy trades, the more important execution costs become. The smaller the average trade, the less room there is for bad fills, spreads, and fees. The less liquid the instrument, the more carefully execution needs to be modelled.
A backtest with perfect fills is usually a best case version of reality. A more useful test asks whether the strategy can survive realistic friction.
The goal is not to make the backtest look worse. The goal is to make it more honest.
A strategy that still looks reasonable after slippage, fees, missed fills, and paper trading has earned more attention than one that only works under perfect execution.
Comments
Ask a question or leave feedback. Guests can post too.
Max 2000 characters.
No comments yet.
Quick answers
What is this article about?
Slippage is one of the biggest gaps between backtest results and live trading results.
Who should read this article on Backtesting Slippage, Why Profitable Strategies Can Fail Live?
This article is for retail traders who want a practical understanding of backtesting slippage, why profitable strategies can fail live before moving into backtesting, simulation, paper trading, or broker-connected execution.
What should I do after reading this article?
Use the article to clarify the concept first, then review FlyTradr workflow pages such as the algo trading platform overview, methodology and assumptions, or the FAQs page before making a platform decision.