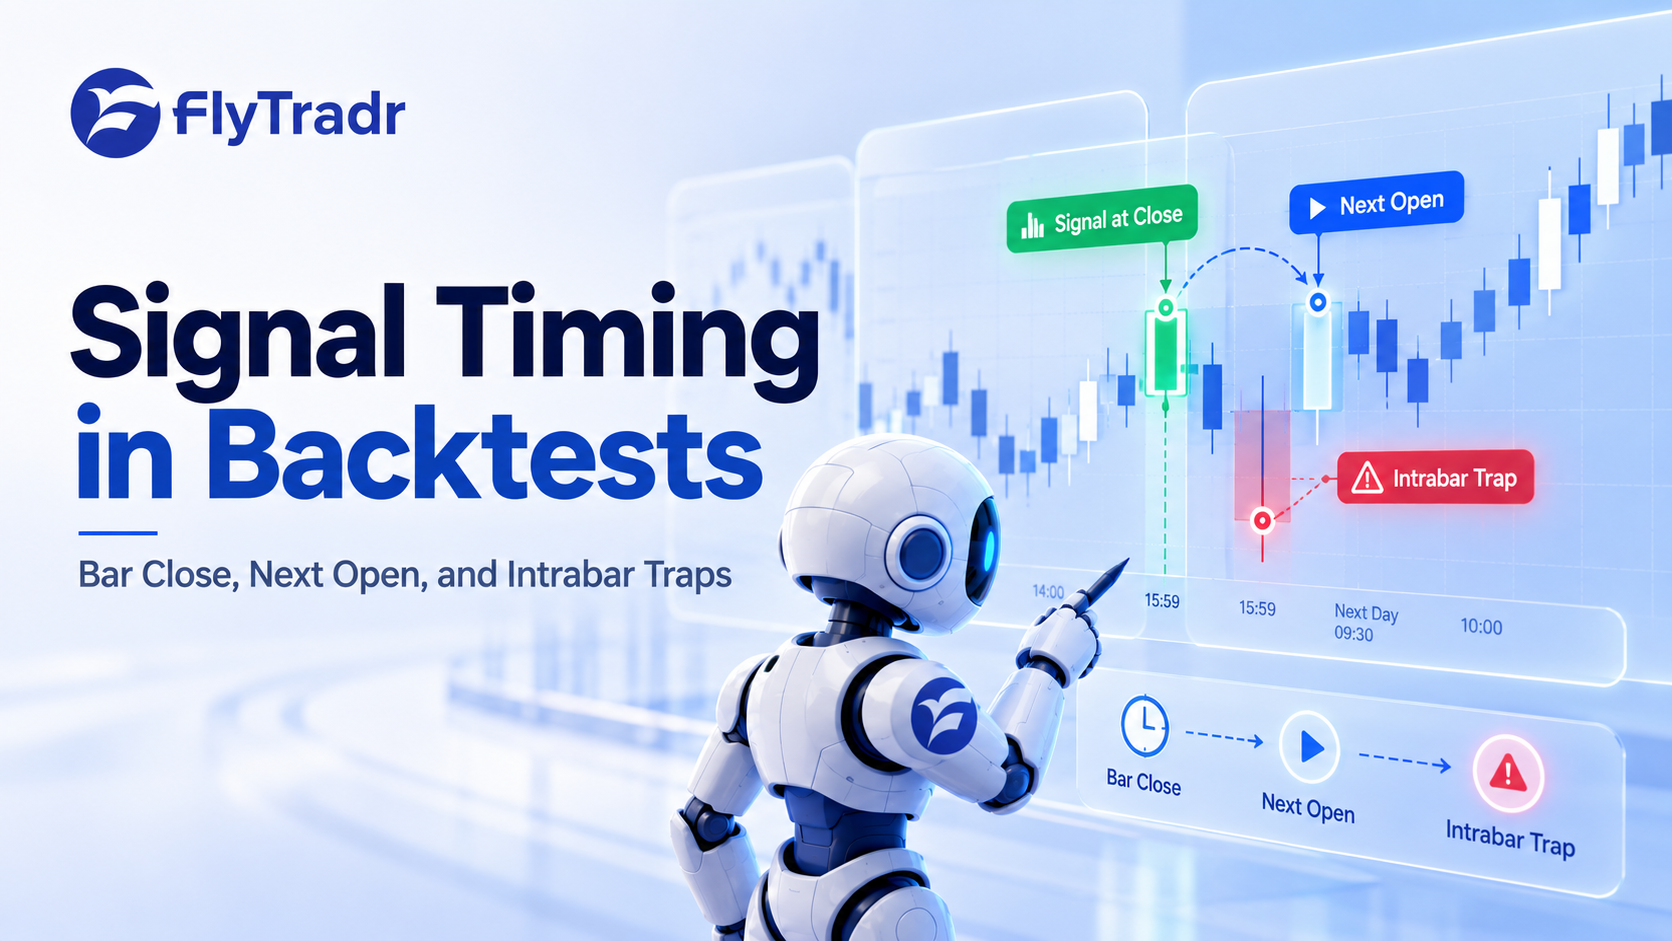
Signal Timing in Backtests: Bar Close, Next Open, and Intrabar Traps
A strategy can have sensible entry rules, realistic risk limits, and a promising equity curve, yet still produce misleading results because of a small mistake in how trades are timed.
Imagine a strategy designed to buy when the daily closing price moves above a moving average. The rule sounds straightforward, and the historical chart may show entries precisely where you would expect them. But there is an important detail to resolve. If the strategy needs the completed daily candle to confirm the signal, how could an order based on that confirmation already have been filled at the very same closing price?
This is one of the most easily overlooked problems in backtesting. Historical data makes it possible to see the full candle at once, while a live strategy receives that information over time. The final high, low, and closing price of a candle are only known when the relevant period has finished. A backtest that ignores this distinction may give its strategy an execution advantage that was never available in practice.
Signal timing is therefore part of strategy validation, not merely a technical setting. Before relying on historical results, traders need to understand when a signal becomes valid, when an order can be submitted, and how the backtest determines the resulting fill.
Why Signal Timing Matters
A historical backtest usually processes market information in bars or candles. Each candle summarises the open, high, low, and close for a particular period, whether that period is five minutes, one hour, or one trading day.
The problem is that these four values do not become available simultaneously. The opening price is known at the start of the period. The high and low develop as prices move, and their final values are only known once the period ends. The closing price is similarly confirmed at the end of the bar.
When you look back at the chart, all four values appear together. If the backtesting engine does not respect their timing, it can mistakenly let a strategy make decisions using information from later in the candle.
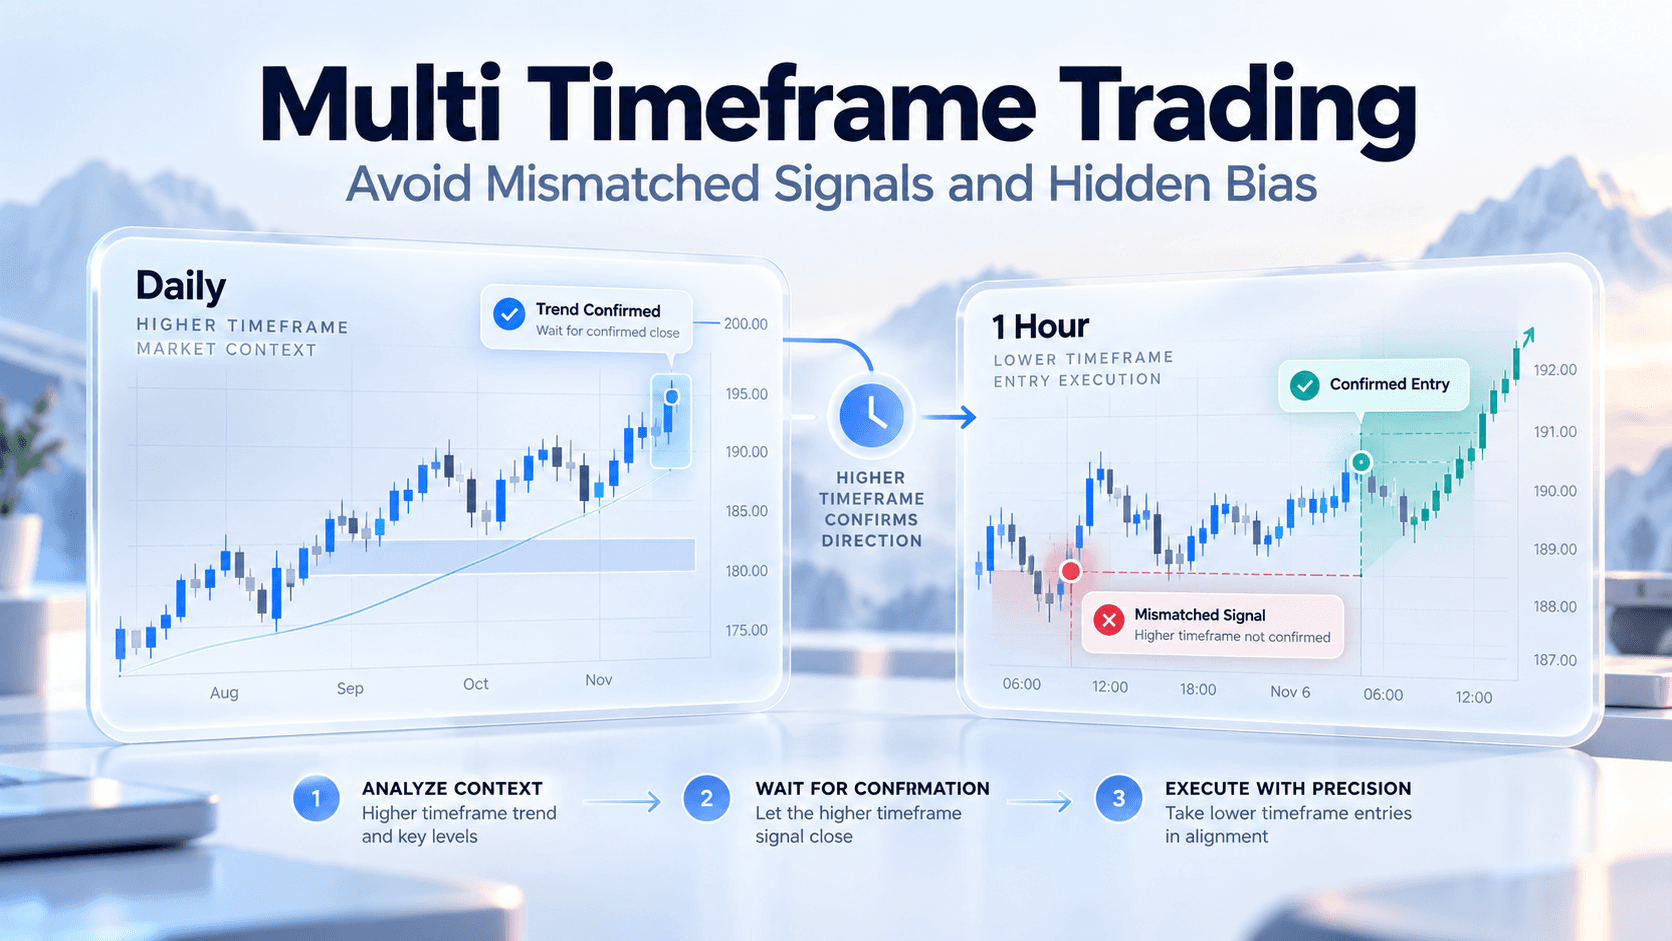
Consider an hourly strategy that requires a candle to close above a resistance level. At 10:30, the price may be above that level, but the 10:00 to 11:00 candle has not yet closed. The price could fall below resistance before 11:00. If the rule requires a confirmed close, an entry placed at 10:30 is not the same strategy as an entry placed after confirmation.
Both approaches can be defined and tested, but the distinction must be deliberate. Otherwise, a seemingly small implementation choice can change the trade count, entry prices, drawdowns, and overall returns.
A Signal, An Order, And A Fill Are Three Different Events
These terms are often discussed as if they are interchangeable, but each represents a different stage of the trading process.
A signal occurs when the strategy's conditions are satisfied according to its defined timing rules. For a bar-close strategy, that may happen only after the candle is complete.
An order is an instruction submitted for execution after the strategy decides to act. Its timing depends on the trading system, market, and order type.
A fill occurs when the order is actually executed. The fill price may differ from the signal price because the market has moved, the spread has changed, or available liquidity is limited.
Separating these events is essential. A rule that says to buy when a candle closes above a moving average does not, by itself, specify how the order will be filled. That is a separate assumption that the backtest must define.
Bar-Close Signals And Next-Open Execution
One common and relatively conservative testing model evaluates the strategy after a candle closes, then assumes that an eligible order is executed at the next bar's opening price, subject to whatever costs and fill assumptions the model applies.
For a daily strategy, this means the signal can be confirmed using today's final closing price, while the hypothetical entry takes place no earlier than the next eligible trading session. For a five-minute strategy, it may mean the signal is confirmed at the end of one five-minute candle and execution is modelled from the start of the next.
This removes a common timing ambiguity, but it does not guarantee a realistic fill. The next opening price may be substantially different from the prior close, especially after overnight news, a trading halt, or a sudden move. A live order may also experience spread, slippage, partial execution, or rejection.
There are legitimate execution workflows that target a session's closing auction, and some strategies place orders before the close using information available at that point. Those workflows require their own rules and market-specific assumptions. They should not be confused with waiting for the final closing price, confirming a signal, and then retroactively assuming execution at that already established price.
The correct approach depends on the strategy being tested. What matters is that the signal and execution model describe something that could actually have happened.
The Intrabar Problem
Bar-close timing is only part of the issue. Historical candles can also hide the sequence of price movements inside a bar.
Suppose a strategy uses a stop loss and a take profit. During a particular hour, the recorded high is above the target and the recorded low is below the stop. Looking only at that hourly candle, both levels were reached at some point. But the candle does not tell you which was reached first.
If the backtest assumes the target was hit before the stop simply because that creates a better result, it may overstate performance. A different sequence could have produced a losing trade instead of a winning one.
The same uncertainty applies to entry conditions. Price might cross above a threshold during a candle and then close below it. A strategy built around intrabar threshold touches could respond to that move, but a strategy requiring a confirmed closing price should not treat it as a completed signal.
More detailed historical data, such as smaller bars or tick-level observations, may help reconstruct the sequence more accurately. Even then, the quality of the execution model matters. Historical prices do not automatically reproduce order-book liquidity, queue position, or the precise fills an actual order would have received.
How Timing Assumptions Can Distort Performance
Timing errors can affect more than a few isolated trades. Their impact can accumulate across the entire test.
A same-close fill assumption may produce better entry prices than a next-open model. An intrabar interpretation may generate trades that a confirmed-close strategy would never have taken. A favourable assumption about which exit was reached first can turn ambiguous losing trades into winners.
The effect can be especially significant for strategies that trade frequently or aim to capture small moves. If the average profit per trade is narrow, even a small difference in execution price can remove much of the apparent advantage.
This is why a backtest should be reviewed alongside realistic fees, spreads, and slippage. These costs are not substitutes for correct timing, but both parts of the model must be credible. A strategy that uses the right signal timing but assumes perfect fills can still produce an overly optimistic result.
A Practical Timing Review Before Trusting A Backtest
The simplest way to begin is to describe a complete trade in plain language, from the first observation to the eventual fill.
For example, a completed-bar strategy might be expressed as follows. At the end of the candle, calculate the indicator using information available through that close. If the entry condition is satisfied, generate a signal and submit an order for the next eligible execution opportunity. Apply the defined order type, fees, spread, and slippage assumptions when modelling the fill.
That short description clarifies several issues that are easy to miss in an attractive results dashboard. You know which bar confirms the signal, when the strategy can act, and which execution price is being assumed.
Next, inspect a sample of individual trades. Check the candle that generated each signal and compare its timestamp with the assumed order and fill timestamps. Confirm that no trade used a completed-bar indicator value before the bar had finished. For stop losses and targets, pay particular attention to candles where both exit levels fall inside the recorded trading range.
Finally, run a sensitivity comparison. Where the platform supports it, compare the original execution model with a stricter alternative, such as next-open execution or less favourable assumptions for ambiguous intrabar fills. Include realistic transaction costs in both tests.
A weaker result does not automatically mean the original strategy is invalid. It does show how much the performance depends on timing assumptions. If an apparent edge disappears under small, plausible changes, the strategy deserves further investigation before moving forward.
Compare The Strategy You Intended With The Strategy You Tested
This distinction becomes particularly important when an idea moves from a historical backtest into simulation or paper trading.
A trader may believe the strategy waits for confirmed candles, while the historical engine models fills during those same candles. The strategy can then behave differently when it starts receiving live market data. Signals may appear later, entry prices may change, and some trades may not occur at all.
Differences between historical and forward results can have many causes, including market conditions, data quality, costs, and implementation. Timing is one of the first assumptions worth checking because it determines which information the strategy was allowed to use and when it was allowed to act.
It also helps to keep strategy versions separate. If you change a close-confirmed rule into an intrabar rule, you have changed the strategy's behaviour, not merely improved its execution. That change should be tested and evaluated as a distinct version.
How FlyTradr Fits Into The Review Process
A disciplined testing workflow starts with clear rules. In the FlyTradr Strategy Builder, traders can structure their entry, exit, and risk conditions before reviewing the strategy in the Backtesting Lab.
When interpreting the results, it is important to understand the signal and execution assumptions supported by the selected test configuration. A performance report is only as informative as the rules and assumptions behind it.
The Simulator can help review strategy behaviour through selected historical periods, while the Paper Trader provides another stage for observing supported strategies on incoming market data. These stages offer additional evidence about whether the intended behaviour matches what the trading workflow actually produces.
No platform can turn an unclear trading rule into a trustworthy result automatically. Clear signal definitions, realistic execution assumptions, and careful review remain essential.
The Bottom Line
A strategy signal and an executed trade are different events, and a reliable backtest needs to respect the time between them.
For rules that require a completed candle, the final candle values must be available before the strategy can act on them. The subsequent fill must be modelled according to a plausible execution process. Intrabar strategies require their own explicit assumptions, especially when historical bars cannot reveal the order in which prices reached entry, stop, or target levels.
Before trusting a promising result, verify when the signal became available, when the order could have been submitted, how the fill was determined, and whether costs were accounted for. Then test whether the conclusion survives more conservative assumptions.
The aim is to make sure the strategy you intend to trade is the same strategy your backtest actually measured.
Comments
Ask a question or leave feedback. Guests can post too.
Max 2000 characters.
No comments yet.
Quick answers
What is this article about?
A strategy can look profitable only because it acts before its signal was actually available.
Who should read this article on Signal Timing in Backtests: Bar Close, Next Open, and Intrabar Traps?
This article is for retail traders who want a practical understanding of signal timing in backtests: bar close, next open, and intrabar traps before moving into backtesting, simulation, paper trading, or broker-connected execution.
What should I do after reading this article?
Use the article to clarify the concept first, then review FlyTradr workflow pages such as the algo trading platform overview, methodology and assumptions, or the FAQs page before making a platform decision.