Monte Carlo Analysis for Trading Strategies: What Trade Reordering Can Reveal
A backtest may show an attractive return, a manageable maximum drawdown, and an equity curve that rises steadily over time. Those results are useful, but they describe only one historical experience. The trades happened in a particular order, during a particular market period, under a particular set of assumptions. They do not tell you how difficult the same strategy might have felt if its losses had arrived closer together.
Consider a strategy that produces a long sequence of small gains, followed by a short losing period, and then recovers. The overall result may look acceptable because the profitable months came first. Now imagine experiencing many of those losses near the beginning, before the strategy has built up any gains. The individual outcomes could be the same, yet the drawdown could feel much harder to tolerate and could create very different decisions about capital allocation or whether to continue trading.
This is one of the questions Monte Carlo analysis can help investigate. By generating alternative sequences or samples of historical outcomes, it allows traders to look beyond the single equity curve produced by a backtest. The purpose is to understand a wider range of possible experiences, especially uncomfortable ones, before deciding how much confidence to place in a strategy.
Why One Equity Curve Is Not Enough
Every backtest is tied to the order in which market events occurred. A profitable year can begin with gains, suffer losses in the middle, and finish with a recovery. Another year with a similar collection of trade outcomes could start with repeated losses and leave the trader questioning the strategy before its stronger period arrives.
Sequence matters because traders do not experience the final return all at once. They experience every losing trade, every period without a new equity high, and every decision about whether the strategy is still behaving as expected. A result that looks comfortable in hindsight can be difficult to follow in real time.
The historical maximum drawdown is therefore a record of what happened in that particular test. It is not a guaranteed upper limit on future losses. A different arrangement of losing trades, a change in position size, or unfamiliar market conditions could produce a more difficult outcome.
Monte Carlo analysis offers a way to investigate some of that uncertainty. It does not reveal what the future will look like. It explores what could happen under the assumptions used to generate the alternative paths.
What Monte Carlo Analysis Actually Does
In trading research, Monte Carlo analysis refers to a family of simulation methods rather than one fixed test. The common idea is to generate many alternative outcomes from a specified model or historical sample, then examine the distribution of results instead of relying on a single number.
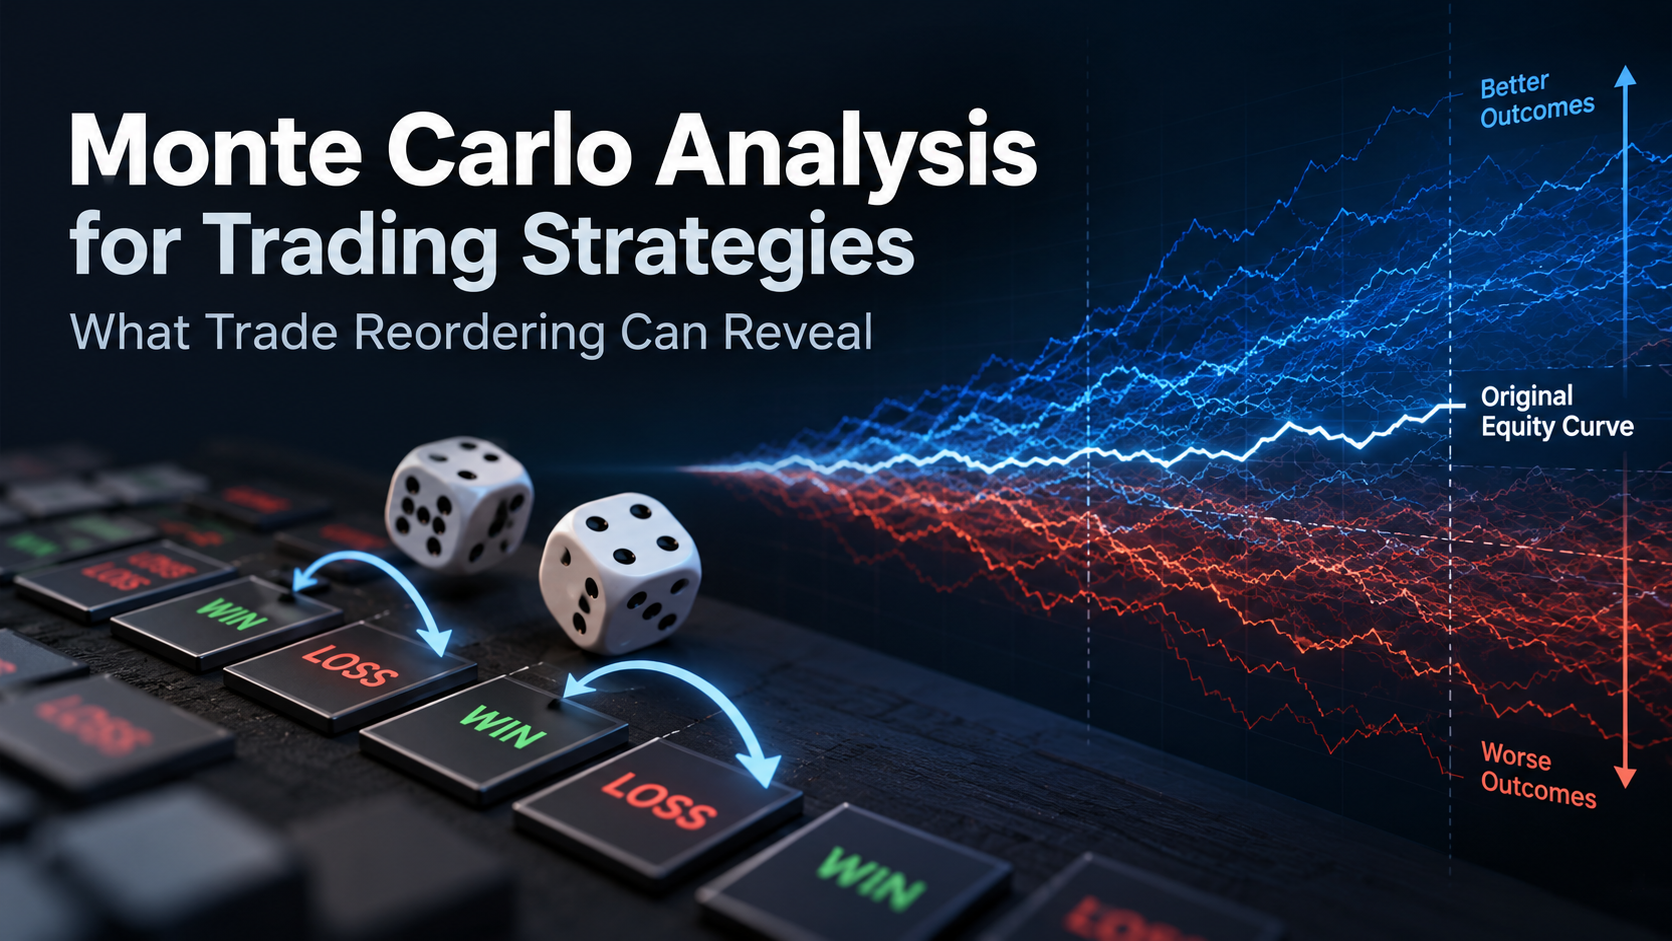
For a simple trade-based exercise, you might start with a completed backtest and its list of trade returns. The simulation produces many alternative equity paths using those results. Some paths may encounter losses earlier or in longer clusters. Others may experience a smoother progression. Reviewing the range of outcomes can highlight risks that were less visible in the original historical order.
Two approaches are especially useful to understand because they answer different questions.
Reordering Existing Trades
In a trade-reordering simulation, the outcomes from the backtest are shuffled into different sequences. Each simulation contains the same set of outcomes, but their order changes.
This method is useful for exploring sequence risk. It can show how losing streaks, drawdown depth, or recovery experience might differ if trades with similar outcomes occurred in another order. It deliberately preserves the historical collection of trades, so it does not introduce a previously unseen large loss or a new type of market event.
There is an important limitation. If the model uses fixed trade profits and losses and a fixed starting capital, the final monetary profit remains the same after a pure reorder; only the path changes. If it uses fixed percentage returns with full compounding and no path-dependent constraints, the final compounded return also remains unchanged. In those cases, a range of final returns would not be an appropriate output of reordering alone. Changes to ending capital require other assumptions, such as resampling outcomes, changing position size, applying trading constraints, or introducing path-dependent costs.
Resampling Historical Trades
In a resampling simulation, outcomes are drawn from the historical trade list, often with replacement. That means one historical outcome may appear several times in a simulated path while another may not appear at all.
Unlike a simple reorder, resampling can change the mix of wins and losses in each simulation. This can produce a distribution of ending returns as well as different drawdowns and losing streaks. It is useful for studying how sensitive a strategy may be to the particular sample of trades observed during the backtest.
The trade-off is that the exercise still depends on the available historical outcomes. If the dataset contains few severe losses, the simulations may underrepresent severe losses too. Drawing each trade independently can also ignore market regimes, clusters of losses, and other dependencies between trades.
What The Results Can Reveal
The most useful output is usually not the best simulated equity curve. It is the spread of outcomes, including the paths that would be difficult to live through.
Maximum drawdown is often the first metric worth examining. Instead of looking only at the maximum drawdown recorded in the original backtest, review the distribution of simulated drawdowns. How much worse do the more difficult paths become under the chosen assumptions? Would your position sizing and risk limits still be acceptable?
Losing streaks can be equally revealing. A strategy may have an acceptable overall win rate while still experiencing several consecutive losing trades. The order in which those losses arrive may matter more to a trader's ability to follow the system than the headline win rate suggests.
Time spent below a previous peak is another useful measure. Two paths can reach similar outcomes, yet one may recover quickly while another remains in a drawdown for much longer. The latter can create pressure to interfere with a strategy even when it is operating as designed.
Final outcomes can also be reviewed when the simulation method permits them to vary, such as under trade resampling or models that change returns and costs. The key is to match the metric to the method rather than displaying a distribution that the underlying simulation cannot actually produce.
These results are conditional scenarios, not probabilities that should automatically be treated as predictions. A simulated percentile is meaningful only to the extent that the model and its assumptions represent the risks you care about.
A Simple Example Of Sequence Risk
Imagine a strategy with a historical record containing several profitable trades and several losing trades. In the original backtest, losses were scattered between winning periods, so the equity curve recovered frequently and its longest losing streak was relatively short.
A reordering exercise might place more of those losing trades next to one another. The overall collection of outcomes has not improved or deteriorated, but the path can become less comfortable. The trader may encounter a longer losing streak, a deeper temporary decline, or a longer wait for a new equity high.
This is valuable information because it asks whether the strategy is manageable under a less convenient sequence. If the risk plan depends on losses being neatly spaced apart, it may be too optimistic.
However, reordering has to be interpreted carefully. The original trade sequence may contain information about changing market conditions, volatility, and the way the strategy responds to previous trades. Shuffling outcomes can break those relationships. A simulation that assumes the strategy can experience any trade in any order may be useful as a stress exercise without being a realistic model of market behaviour.
Where Monte Carlo Analysis Can Mislead You
Monte Carlo analysis can make a strategy review more thorough, but it can also create false precision if its assumptions are ignored.
The first limitation is data quality. If the original backtest uses future information, omits delisted instruments, ignores costs, or relies on unrealistic fills, simulations built from those trades inherit the underlying problems. Running thousands of paths cannot repair a flawed sample.
The second limitation is overfitting. If the strategy was tuned repeatedly until one historical configuration looked exceptional, resampling those outcomes does not establish that its apparent edge will continue. Out-of-sample and forward testing still matter.
The third limitation is dependence between trades. Trading results may cluster by volatility environment, market direction, or liquidity conditions. An independent trade shuffle or resample can overlook those connections. More advanced approaches may preserve blocks of consecutive observations or explicitly model regimes, but they introduce their own assumptions and should not be treated as automatic improvements.
Finally, Monte Carlo analysis cannot reliably anticipate conditions that are absent from the historical sample. A market shock, execution failure, or prolonged change in market behaviour may produce losses outside the range suggested by a basic simulation. A neatly presented confidence interval should never be mistaken for a guarantee.
How To Use Monte Carlo Alongside Backtesting
A useful workflow begins with a backtest you already understand. Keep the strategy version fixed and review the trade list, costs, position sizing, and drawdowns before running additional simulations. Confirm that the test has a meaningful sample and that the execution assumptions are reasonable.
Then decide what question you want the simulation to answer. If your concern is whether losses could arrive in a more difficult order, a trade-reordering exercise may be suitable. If you want to explore variations in the observed mix of winning and losing trades, resampling may be more relevant. The choice should come from the risk question rather than from whichever model produces the most attractive output.
When reviewing the results, concentrate on the difficult scenarios. Compare drawdown depth, losing streaks, and recovery periods with your planned capital allocation and predefined risk limits. Consider whether you would still be able to operate the strategy without overriding its rules during a prolonged weak period.
If a significant share of the simulated paths would create unacceptable drawdowns under the chosen assumptions, that does not necessarily mean the strategy should be discarded. It may mean the position size is too large, the risk plan needs revision, or the strategy deserves a longer validation period before real capital is involved.
After the simulation, the next steps remain familiar. Check performance on data that was not used during development, review behaviour across different market regimes, and observe the strategy in paper trading. Each step examines a different weakness. Monte Carlo is one additional perspective within that process.
Where FlyTradr Fits In The Process
A Monte Carlo exercise is only as useful as the underlying strategy records and assumptions. Keeping those records organised makes it easier to compare risk scenarios without losing track of what was actually tested.
With FlyTradr, traders can define rules in the Strategy Builder and review historical outcomes through the Backtesting Lab. A clearly documented strategy version and its trade results provide a starting point for additional analysis, including Monte Carlo methods performed with an appropriate tool or exported data where available.
The Simulator can help examine difficult historical market periods, while the Paper Trader supports observing strategy behaviour on current market data. These steps serve different purposes and should complement one another.
Monte Carlo functionality should not be assumed to be a built-in FlyTradr feature unless it is explicitly available in the product. The broader principle remains the same: a stronger validation process asks more than whether one historical equity curve looked profitable.
The Bottom Line
A historical backtest shows one realised sequence of trades. It can tell you a great deal about how a strategy behaved during the test period, but it cannot show every uncomfortable path that might arise from different outcomes or a different ordering of losses.
Monte Carlo analysis can help explore that uncertainty through clearly defined simulations. Trade reordering can highlight sequence risk, while resampling can reveal how results may vary when the mix of historical outcomes changes. Neither approach is a forecast, and neither can make incomplete or biased historical data trustworthy.
The practical value comes from reviewing the difficult scenarios rather than searching for the most reassuring one. If your strategy, position sizing, and drawdown plan remain acceptable under a range of reasonable assumptions, you have learned something useful about their resilience. If they do not, you have identified a risk worth addressing before deployment.
A strong strategy validation process should help you understand what could go wrong, even when the original equity curve looks good.
Comments
Ask a question or leave feedback. Guests can post too.
Max 2000 characters.
No comments yet.
Quick answers
What is this article about?
One historical equity curve cannot show every difficult path a strategy might take.
Who should read this article on Monte Carlo Analysis for Trading Strategies: What Trade Reordering Can Reveal?
This article is for retail traders who want a practical understanding of monte carlo analysis for trading strategies: what trade reordering can reveal before moving into backtesting, simulation, paper trading, or broker-connected execution.
What should I do after reading this article?
Use the article to clarify the concept first, then review FlyTradr workflow pages such as the algo trading platform overview, methodology and assumptions, or the FAQs page before making a platform decision.