

Paper Trading vs Backtesting, What Each Proves And What It Does Not
A strategy can look convincing in a backtest and still behave very differently when it begins receiving live market data.
That does not automatically mean the backtest was wrong. It usually means the backtest answered only one part of the question.
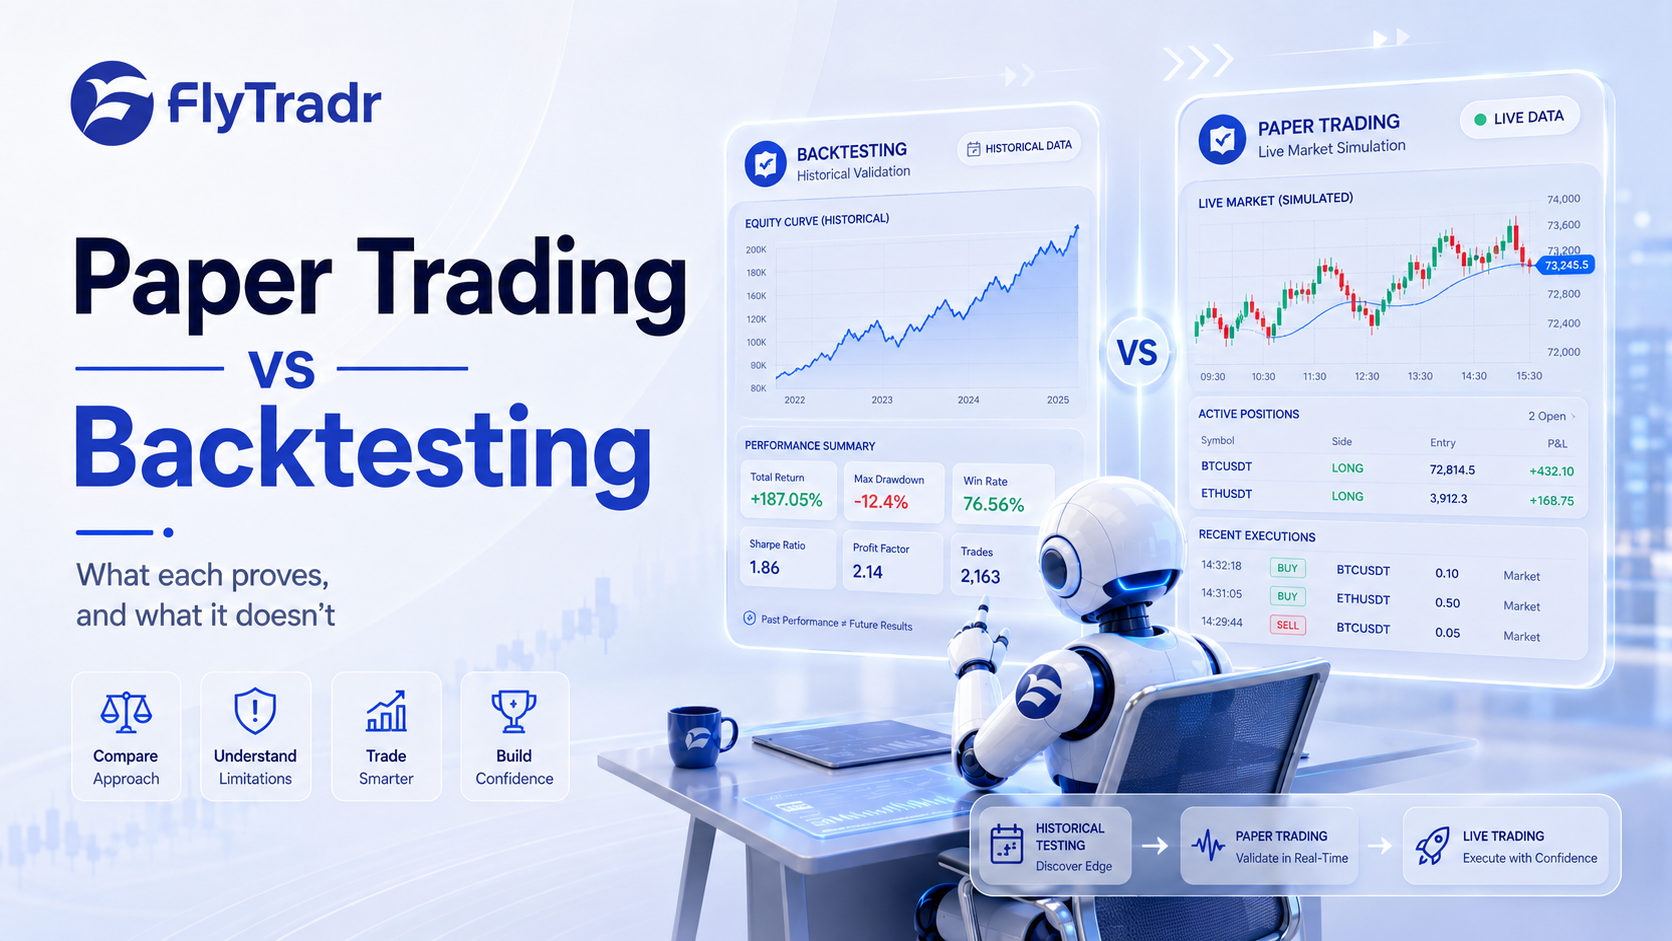
Backtesting helps you study how a defined set of rules would have behaved on historical data. It can reveal whether the idea had positive expectancy, how large the drawdowns were, how often it traded, and whether the result depended heavily on one parameter or market period.
Paper trading answers a different set of questions. It shows how the strategy behaves as new data arrives, whether the automation works as expected, whether orders are generated correctly, and whether the live workflow resembles the assumptions used in the backtest.
Neither stage proves that a strategy will be profitable with real money. They are validation tools, and they are most useful when they are treated as separate layers of the same process.
This guide explains what backtesting and paper trading can reasonably tell you, what they cannot prove, and how to use both before considering live deployment.
Backtesting And Paper Trading Are Testing Different Things
The easiest way to understand the difference is to look at the environment in which each test runs.
A backtest runs the strategy over historical market data. Years of trades can often be processed in a short period, making it useful for testing ideas, comparing variations, and studying performance across different market conditions.
Paper trading runs the strategy forward on live or delayed market data using simulated capital. You must wait for signals to occur naturally, but you get to observe the strategy as it operates rather than reviewing its decisions with the benefit of hindsight.
The distinction matters because a strategy has two separate challenges.
First, the rules need to show that they had a meaningful historical pattern worth investigating.
Second, the full trading workflow needs to function correctly as new market data arrives.
Backtesting focuses mainly on the first challenge. Paper trading helps investigate the second.
What Backtesting Can Show You
Whether The Rules Had Historical Expectancy
A backtest can show whether a specific rule set produced a positive or negative result over the period tested.
Suppose you define a momentum strategy and run it over several years of data. The result can show how often the strategy traded, how much it gained or lost, how the equity curve developed, and which market periods contributed most to the outcome.
This can tell you that the rules had positive expectancy during the test period. It cannot tell you that the same expectancy will continue.
The period may have favoured the strategy. The rules may have been adjusted after repeatedly reviewing the same data. The market structure may change. Historical performance is evidence about the past, not a promise about the future.
The Shape Of The Strategy
A useful backtest shows much more than the final return.
It can reveal:
Maximum and average drawdown
Win rate
Average winning and losing trade
Profit factor
Trade frequency
Holding time
Losing streaks
Long and short side contribution
Monthly or yearly consistency
Sensitivity to transaction costs
These metrics help you understand how the strategy produced its result.
Two strategies may finish with a similar return while taking very different paths. One may experience deep drawdowns and long recovery periods. Another may produce a steadier equity curve but trade less frequently. That difference matters when deciding what deserves further testing.
Whether The Result Survives Reasonable Variations
Backtesting is also useful for sensitivity testing.
If a strategy works only with one exact indicator value, one narrow timeframe, or one specific test period, the result may be fragile. If nearby parameter values and related market periods produce reasonably similar behaviour, the idea may be more robust.
The goal is not to search endlessly for the highest return. It is to understand how easily the result breaks when reasonable assumptions change.
This is where batch testing and variation comparison become useful. You can compare timeframes, trade directions, risk settings, and related parameter values without treating the best performing run as the automatic winner.
How Costs Could Affect The Result
A backtest can model commissions, spread assumptions, and slippage. This is particularly important for strategies that trade frequently or target small moves.
The model is still an estimate. It allows you to ask whether the strategy has enough margin to survive realistic costs, but it cannot prove that live fills will match those assumptions.
A strategy that is only profitable with zero costs or perfect execution should be treated cautiously.
What Backtesting Does Not Prove
That Live Orders Will Be Filled As Expected
Historical bars do not recreate every detail of a live order book.
A backtest may assume that an order was filled at the signal price, the next bar open, or another predefined price. In live markets, the actual fill can be affected by spreads, liquidity, order type, price movement, and execution delay.
This gap is especially important for lower timeframe strategies, market orders during fast moves, and instruments with limited liquidity.
More detailed historical data can improve the simulation, but it cannot eliminate the difference between a model and a live market.
That The Broker Workflow Is Correct
A backtest does not confirm that a broker supports every order type, quantity rule, contract size, or risk control required by the strategy.
It also does not test whether the API connection remains stable, whether rejected orders are handled correctly, or whether the strategy behaves safely after a restart or connection failure.
These are operational questions. They need to be tested in an environment that more closely resembles the live workflow.
That The Strategy Will Behave The Same On New Data
A historical result can be affected by overfitting, data selection, and market regime.
Out of sample and walk forward testing can reduce this risk by separating the data used to develop the idea from the data used to evaluate it. They still do not prove future performance, but they provide a more demanding test than repeatedly optimising on the same period.
That You Will Tolerate The Strategy In Practice
A backtest compresses time. A six month drawdown may appear as a section of a chart that you review in seconds.
Living through that period is different.
Even with an automated strategy, the trader must decide whether to keep the system running, reduce exposure, change the rules, or stop it entirely. A historical chart cannot fully reproduce the uncertainty of watching a strategy underperform in real time.
What Paper Trading Can Show You
Paper trading uses simulated capital while the strategy receives current market data. Depending on the platform and broker, the environment may resemble live trading closely, but the fills are still simulated.
Interactive Brokers, for example, describes paper trading as a simulated environment that uses market conditions while also noting that paper trading is not exactly the same as live trading. Its documentation lists differences in how some order types and fills are handled.
That is a useful way to frame paper trading. It is closer to live operation than a historical backtest, but it is not a perfect replica of live execution.
Whether The Strategy Operates Correctly As New Data Arrives
Paper trading can reveal whether signals appear at the expected time, whether orders are created correctly, and whether the strategy manages open positions according to its rules.
This can expose issues that are difficult to see in a backtest.
A strategy may generate repeated orders when a condition remains true. It may fail to recognise an existing position after a restart. A quantity may be rounded incorrectly. A stop or target may be placed on the wrong side of the market.
These are implementation problems rather than strategy logic problems, but they can have serious consequences in live trading.
Whether The Broker And Automation Workflow Work Together
Paper trading can help test:
Broker connectivity
Order submission
Quantity and tick size handling
Position tracking
Stop and target creation
Rejected order handling
Session start and end behaviour
Recovery after a disconnection or restart
A successful backtest cannot validate any of these operational details.
Whether Trade Frequency Matches Expectations
A backtest may show a certain average number of trades per week or month. Paper trading lets you observe how that frequency feels in real time.
The strategy may remain inactive for long periods and then generate several signals close together. That behaviour may have been visible in the historical results, but it often becomes more noticeable when you are waiting for trades to appear naturally.
A meaningful difference between expected and observed frequency should be investigated. It may come from data timing, indicator calculation, session settings, signal confirmation, or implementation differences.
Whether Your Monitoring Process Is Practical
For a fully automated strategy, paper trading is not mainly a test of whether you manually follow every signal. The system should do that itself.
It is still a useful test of whether your operational process is realistic.
Do you know what information to monitor. Can you recognise an abnormal order. Do you have a process for pausing the strategy. Are alerts clear. Can you explain why a position is open.
Paper trading gives you time to build that discipline without placing real capital at risk.
What Paper Trading Does Not Prove
That Live Fills Will Match Simulated Fills
Simulated fills may be more favourable or simply different from live execution.
A paper account does not necessarily compete for liquidity in the same way as a live order. It may not model queue position, partial fills, market impact, or every broker specific execution rule accurately.
This is why a paper result should not be described as proof that a strategy can execute profitably in live markets. It shows how the strategy behaved in a simulation using current data.
That is valuable, but it is a narrower claim.
That The Strategy Can Handle Large Position Sizes
A simulated order does not move the market.
A live order may face limited liquidity, wider spreads, partial fills, or market impact as position size increases. The paper environment may therefore be informative for small orders but less representative for large positions.
Scaling should be gradual even after paper trading.
That You Will React The Same Way With Real Money
Paper losses do not carry the same emotional weight as real losses.
The trader may be patient during a simulated drawdown and much less patient when real capital is involved. Paper trading can improve familiarity with the strategy, but it cannot fully reproduce financial pressure.
That Rare Operational Failures Have Been Covered
A short paper trading period may not include an exchange outage, broker interruption, severe gap, corrupted data feed, or unusual market event.
Testing should therefore include deliberate failure scenarios where possible. What happens if the data stops. What happens if an order is rejected. What happens if the application restarts while a position is open.
Waiting for these situations to occur naturally is not enough.
A Practical Comparison
Question | Backtesting | Paper Trading |
|---|---|---|
Did the rules have historical expectancy | Useful | Limited |
How did the strategy behave across past regimes | Useful | Depends on how long the test runs |
Can variations be compared quickly | Useful | Slow |
Does the automation work on incoming data | Limited | Useful |
Does the broker workflow behave as expected | No | Useful |
Are fills representative of live execution | Estimated | Simulated, still imperfect |
Can rare historical periods be studied quickly | Useful | No |
Does the strategy feel practical to monitor | Limited | Useful |
Does it prove future profitability | No | No |
The important point is that the two methods are complementary. One does not replace the other.
A Better Validation Workflow
There is no universal number of years, trades, or days that makes a strategy ready. A slow strategy may need months of forward testing to produce a useful sample, while an active strategy may generate enough trades much sooner.
The workflow should be based on the strategy rather than a fixed calendar rule.
Step 1, Define The Rules Clearly
The entry, exit, position sizing, market, timeframe, and trading session should be explicit enough that the strategy can be implemented without interpretation.
A vague idea cannot be tested reliably.
Step 2, Run A Historical Backtest
Use the FlyTradr Backtesting Lab to study the historical behaviour of the rules.
Include realistic cost assumptions and review the full performance profile rather than focusing only on return.
Step 3, Test Variations And Unseen Data
Compare reasonable variations using the same market and test period. Then evaluate the strategy on data that was not used to shape the original rules.
The aim is to understand sensitivity, not to find the single highest returning configuration.
Step 4, Replay Difficult Periods
Use the FlyTradr Simulator to inspect how the strategy behaves during specific market environments.
Replay can make drawdowns, bursts of activity, and changing market conditions easier to understand than a static summary page.
Step 5, Paper Trade On Current Data
Deploy the strategy through the FlyTradr Paper Trader and observe it over a period long enough to produce a meaningful sample.
Track implementation issues, order behaviour, trade frequency, and any differences between the historical assumptions and forward operation.
Step 6, Compare The Evidence
Do not expect paper trading results to match the backtest trade for trade. The periods are different, and the market conditions may be different.
Instead, compare the broader behaviour.
Is the strategy trading at a plausible frequency. Are average gains and losses within a reasonable range. Are costs materially higher. Are drawdowns and losing streaks consistent with what the historical test suggested was possible.
Step 7, Consider Live Deployment With Limited Exposure
If the strategy passes the earlier stages, broker connection and live deployment can be managed from the FlyTradr Dashboard.
Starting with limited exposure reduces the cost of discovering differences that were not visible in the simulated environment. Position size can be increased gradually only if the live workflow behaves as expected.
How To Paper Trade Properly
Keep The Strategy Rules Unchanged
Changing the rules during every weak period makes the paper test difficult to interpret.
If a change is necessary, record it and treat the revised strategy as a new version. Then test that version separately.
Use Realistic Capital And Position Sizing
A paper account with unrealistically large capital can hide constraints that would exist in the real account.
Set the simulated balance, leverage, and position sizing close to the intended live setup. This makes exposure, drawdown, and order quantities more meaningful.
Track Differences, Not Just Profit And Loss
Record the differences between the expected and observed workflow.
Useful observations include:
Expected signal time and actual signal time
Expected order and submitted order
Intended quantity and accepted quantity
Rejected or modified orders
Strategy restarts
Missed data
Differences in trade frequency
Differences in holding time
The purpose of paper trading is not merely to produce another return figure. It is to find operational gaps before they become expensive.
Test Failure Scenarios
Where possible, test what happens when:
The broker connection drops
Market data stops temporarily
The application restarts with an open position
An order is rejected
A position is partially filled
The market opens with a gap
The strategy receives duplicate data
A trading system should have a defined response to abnormal conditions, not only normal ones.
Common Mistakes
Treating A Strong Backtest As Deployment Approval
A strong historical result means the idea deserves further investigation. It does not mean the strategy has passed execution and operational testing.
Treating Paper Profits As Live Proof
Paper trading can reveal whether the workflow functions on current data. It cannot reproduce every aspect of live fills, liquidity, market impact, or emotional pressure.
Using Arbitrary Time Requirements
Thirty days may be enough for an active strategy and almost meaningless for a strategy that trades twice a month.
Use trade count, market coverage, and observed behaviour to decide whether the paper test has produced enough evidence.
Ignoring Differences Between The Two Environments
If paper trading produces fewer trades, different holding times, or unexpected orders, investigate the cause.
Do not dismiss the difference simply because the paper account is still profitable.
Changing Multiple Things At Once
If you change the entry rule, timeframe, position sizing, and exit rule together, you will not know which change affected the outcome.
Create strategy versions and change one major assumption at a time.
How FlyTradr Connects The Workflow
FlyTradr is designed to keep the stages connected without treating them as interchangeable.
You can define the rules in the Strategy Builder, study historical behaviour in the Backtesting Lab, replay selected periods in the Simulator, and run the strategy on current market data through the Paper Trader.
When the strategy has passed those stages, broker connection and live deployment are available through the Dashboard.
The platform can make the workflow easier to manage. It cannot remove the need for careful judgement. Each stage should reduce a different type of uncertainty before the strategy moves forward.
The Bottom Line
Backtesting and paper trading are both useful, but they do not prove the same thing.
Backtesting helps you understand whether the strategy rules had historical merit, how the risk developed, and whether the result survived reasonable variations.
Paper trading helps you understand whether the strategy operates correctly on incoming data, whether the automation and broker workflow behave as expected, and whether the live process resembles the assumptions used during development.
Neither stage guarantees future profits. Neither should be treated as a final approval on its own.
A stronger process is to use historical testing to investigate the idea, simulation to understand its behaviour, paper trading to validate the workflow, and limited live exposure to discover the remaining differences carefully.
The objective is not to make a backtest come true. It is to remove avoidable surprises before real capital is involved.
Comments
Ask a question or leave feedback. Guests can post too.
Max 2000 characters.
No comments yet.
Quick answers
What is this article about?
Backtesting proves historical edge.
Who should read this article on Paper Trading vs Backtesting: What each proves (and what it doesn't)?
This article is for retail traders who want a practical understanding of paper trading vs backtesting: what each proves (and what it doesn't) before moving into backtesting, simulation, paper trading, or broker-connected execution.
What should I do after reading this article?
Use the article to clarify the concept first, then review FlyTradr workflow pages such as the algo trading platform overview, methodology and assumptions, or the FAQs page before making a platform decision.