Most traders do not usually get into trouble because they failed to run a backtest. They get into trouble because they ran one backtest, liked what they saw, and treated that result as if it answered everything.
That is a very easy mistake to make. A backtest can look clean, the return can look attractive, and the drawdown can look manageable. At that point, it is tempting to assume the strategy is ready for the next step. But one backtest is still only one version of one idea, tested under one set of assumptions.
A better way to think about strategy testing is to ask a slightly different question. Instead of asking whether the strategy worked, ask how the strategy behaves when the assumptions change. What happens when the timeframe changes. What happens when the strategy is long only. What happens when it is allowed to trade both long and short. What happens when the market is not trending in the direction you expected.
That is what this article is about. I recently tested a broad Bollinger Band based idea on BTCUSDT using FlyTradr. The purpose was to study how the same broad idea behaved when tested across different variations.
The result was a useful reminder. A good backtest can be interesting, but a stress tested idea is much more useful.
The Problem With A Single Backtest
A single backtest can create confidence very quickly. That confidence may be useful if it pushes you to investigate further, but it becomes dangerous if it makes you stop asking questions.
A backtest only tells you how a specific version of a strategy behaved over a specific period. It does not tell you whether the idea is robust. It does not tell you whether the result depends on one market environment. It does not tell you whether a small change in timeframe, trade direction, cost assumption, or execution quality would change the outcome completely.
This is why a single result should be treated as a starting point, not a final answer. A strategy that looks promising on one timeframe may look ordinary on another. A strategy that looks clean when trading only long may produce a very different profile when short trades are enabled. A strategy that looks attractive before costs may look far less convincing once slippage and fees are included.
Backtesting is still valuable. The issue is not the tool. The issue is how quickly traders sometimes move from one attractive result to real confidence.
The Case Study, What Was Tested
For this case study, I used a broad Bollinger Band based mean reversion idea on BTCUSDT. Bollinger Bands are commonly used to understand when price has moved away from a recent average. Some traders use that information to build mean reversion ideas, where the strategy looks for price to move back toward a central reference area after moving too far in one direction.
For the purpose of this case study I kept most things exactly the same like the indicator settings, entry rules, exit rules, and risk management details. I also kept the test window exactly the same for all test which was 1 year (start date: 5th July 2025 to 5th July 2026)The things that varied across the sessions or batches were signals and the timeframes.
I tested the same broad idea across two important dimensions, timeframe and trade direction. That gave four useful variations to compare (BTW I tested a lot of other timeframes like 30m, 1h, 4h and even 1d) but the strategy worked better on 5m and 15m timeframes.
The variations were:
Long only on a slower timeframe (15 minutes).
Long only on a faster timeframe (5 minutes).
Bi directional on a slower timeframe (15 minutes).
Bi directional on a faster timeframe (5 minutes).
This is a much better way to study an idea than looking at only one backtest. It shows whether the idea is sensitive to timeframe. It shows whether short trades add useful opportunity or simply add noise. It also helps reveal whether a higher return is being supported by acceptable risk metrics, or whether it is just coming from more activity.
Long only batch overview, showing the slower timeframe and faster timeframe comparison

Bi directional batch overview, showing the slower timeframe and faster timeframe comparison.

The Four Variations At A High Level
The first session tested the long only version. The slower timeframe returned 52.64 percent, with 7.04 percent max drawdown, 72.95 percent win rate, and 769 trades. The faster timeframe returned 187.05 percent, with 6.04 percent max drawdown, 76.56 percent win rate, and 2163 trades.
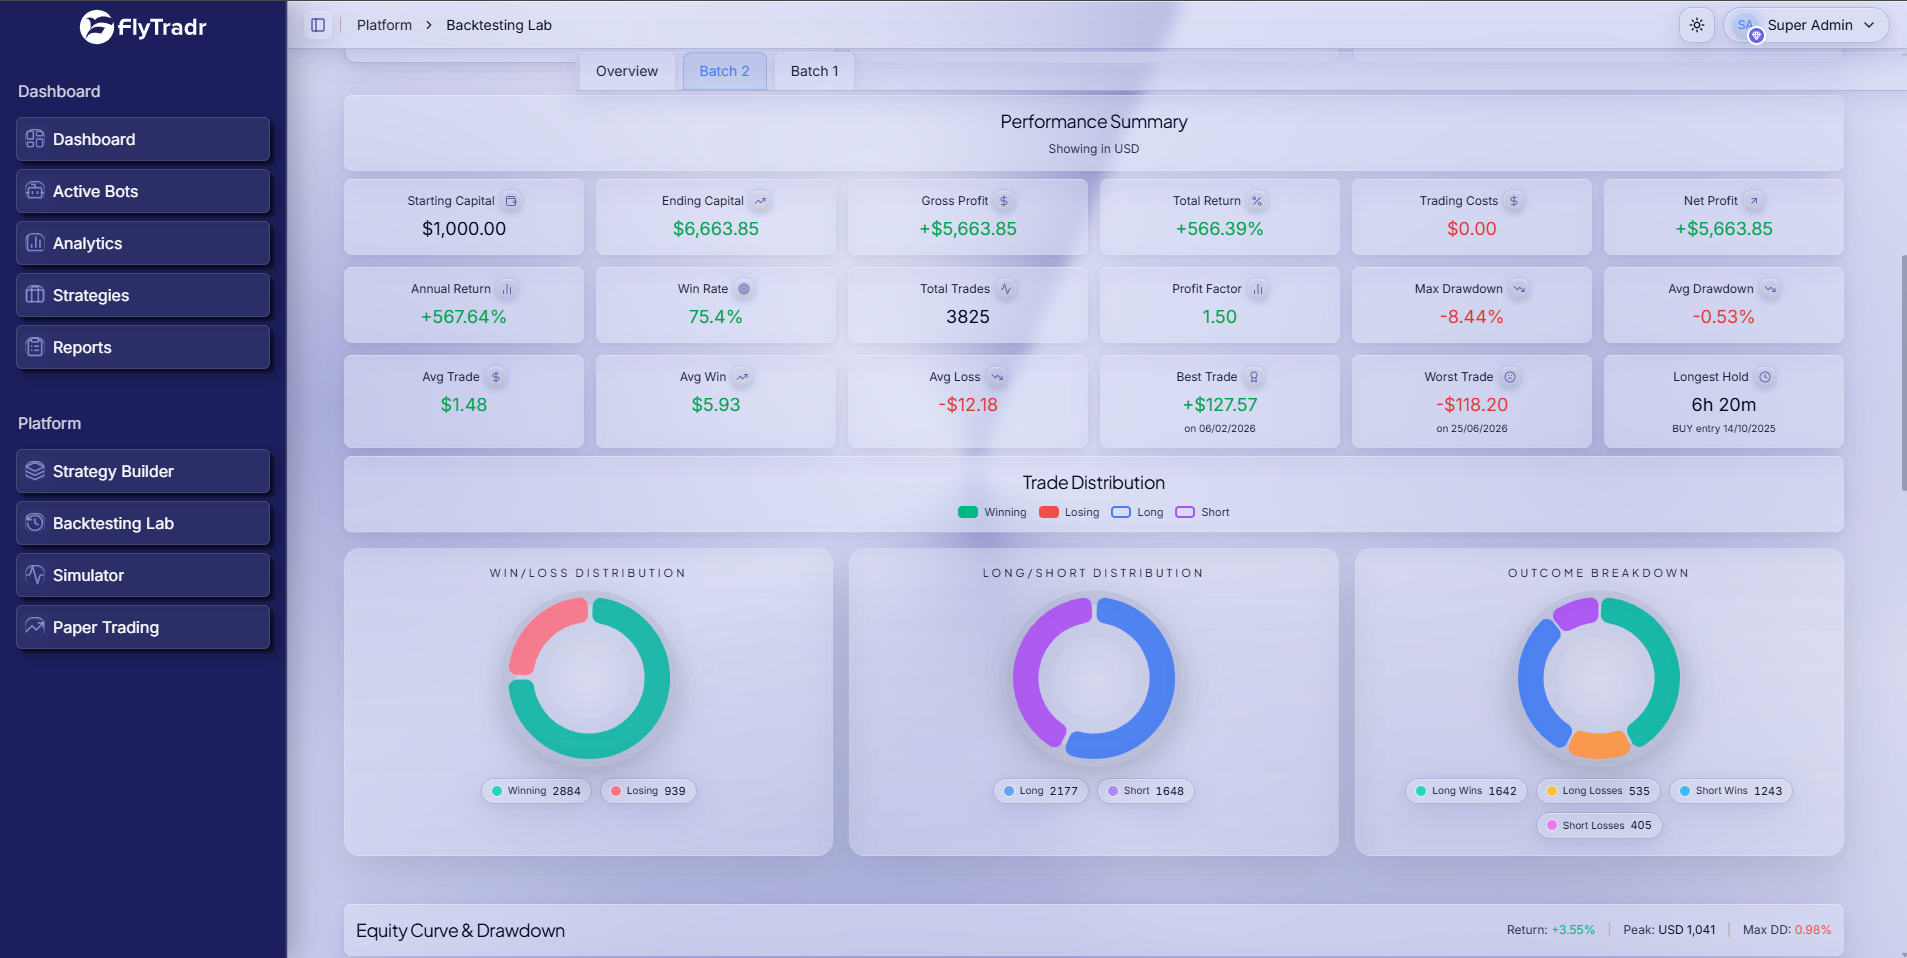
The second session tested the bi directional version. The slower timeframe returned 99.42 percent, with 8.74 percent max drawdown, 71.89 percent win rate, and 1398 trades. The faster timeframe returned 562.51 percent, with 8.44 percent max drawdown, 75.30 percent win rate, and 3818 trades.
Those numbers are not included to suggest that this specific strategy should be copied. They are included because they show how much a strategy idea can change when the test conditions change. The same broad idea produced different profiles depending on timeframe and trade direction.
That is the real lesson. The important part is not that one version had the highest return. The important part is that the comparison exposed tradeoffs that would have been invisible if only one backtest had been run.
A Cleaner Way To Compare The Results
The comparison becomes easier to understand when the four variations are placed side by side.
Variation | Return | Max Drawdown | Win Rate | Trades |
|---|---|---|---|---|
Long only, slower timeframe | 52.64 percent | 7.04 percent | 72.95 percent | 769 |
Long only, faster timeframe | 187.05 percent | 6.04 percent | 76.56 percent | 2163 |
Bi directional, slower timeframe | 99.42 percent | 8.74 percent | 71.89 percent | 1398 |
Bi directional, faster timeframe | 562.51 percent | 8.44 percent | 75.30 percent | 3818 |
This table makes one thing clear. The faster timeframe created more trading activity in both the long only and bi directional versions. In this test, that additional activity also came with stronger returns. But the result still needs interpretation.
A faster timeframe can create more opportunities, but it can also make a strategy more sensitive to costs, slippage, and execution quality. A bi directional version can create more opportunity in sideways or bearish conditions, but it can also add more complexity. A lower drawdown can be attractive, but it should be weighed against the return profile and the number of trades used to produce that result.
This is why comparison matters. Looking at one number in isolation is rarely enough.
What The Timeframe Test Shows
The timeframe comparison is one of the most useful parts of this case study. The faster timeframe performed better in both sessions, but that does not mean faster is always better.
A faster timeframe usually gives a strategy more chances to act. That can help when the underlying idea is strong enough and the additional trades are still high quality. But a faster timeframe can also introduce more noise. It can increase the number of marginal trades. It can make costs more important. It can also make live execution harder because entries and exits may depend on smaller price movements.
The slower timeframe gave fewer trades and a less aggressive result. That is not automatically bad. Some traders may prefer fewer trades, simpler execution, and a calmer strategy profile, especially if the lower timeframe version becomes too sensitive to costs or live fill quality.
The point is not to choose faster or slower by default. The point is to test both, compare the results, and then ask whether the improvement is real enough to survive the next layer of validation.
What The Long Only And Bi Directional Test Shows
The second useful comparison is long only versus bi directional testing. This is where market context becomes important.
A long only version is simpler. It only tries to participate when the strategy sees long side opportunity. For many traders, this can feel cleaner because it avoids short exposure and keeps the system easier to understand.
A bi directional version asks a different question. It asks whether the same broad idea can also respond when the market is weak, sideways, or moving down. In this case study, the bi directional versions produced higher returns than their long only counterparts. That suggests the short side added meaningful opportunity during the tested period.
That does not mean short trading is automatically better. It also does not mean every trader should enable short trades. The better interpretation is that trade direction is an assumption, and assumptions need to be tested.
If a market spends a long period moving sideways or struggling to trend upward, a long only strategy may have fewer useful opportunities. A bi directional strategy may find more opportunities because it is not limited to one side of the market. But in a strong bull market, the comparison could look different. That is why the result should be understood as context, not as a universal rule.
Why Market Regime Matters
A strategy does not operate in a vacuum. It operates inside a market regime.
A bull market can make long only strategies look stronger than they really are. A sideways market can make mean reversion ideas look more attractive. A bearish or choppy period can make short enabled strategies appear more useful. None of these outcomes automatically prove that the strategy is robust.
This is why a trader should always ask what kind of market environment the backtest covered. If the tested period favoured the logic of the strategy, the result may look better than it would in a different regime. If the strategy only performs well in one environment, that is still useful to know, but it changes how the strategy should be understood.
In this case, the bi directional version likely benefited from having the ability to participate when the market was not simply moving upward. That is not a reason to assume short trades will always help. It is a reason to test the idea across multiple market regimes before trusting it.
A good strategy review should not stop at performance. It should also ask why the performance happened.
Why Higher Return Is Not Automatically The Best Answer
The highest return version will naturally attract attention. That is normal. But the highest return is not always the best version to trade.
A higher return may come from more trades. It may come from more exposure. It may come from a market period that favoured one side of the strategy. It may also come with higher sensitivity to execution quality. If those risks are not understood, the trader may be trusting a number without understanding what produced it.
This is why the faster bi directional result should be treated as interesting, not final. It produced the strongest return in this test, but it also had the highest trade count. That means costs, slippage, and live execution become more important. A small difference between assumed execution and real execution can matter when a strategy trades frequently.
The long only faster timeframe version had a lower return, but also a lower drawdown in this comparison. That may be more suitable for some traders depending on their objective. Another trader may prefer the higher return profile of the bi directional version, but only after validating that the extra activity survives costs and paper trading.
There is no single answer that fits everyone. The right version depends on the trader's risk tolerance, market view, execution setup, and validation results.
The Metrics That Actually Matter
Return is useful, but it should not be the only metric in the room. A strategy with a high return and weak supporting metrics can be more dangerous than a strategy with moderate returns and a stable profile.
When comparing variations, a trader should look at max drawdown, win rate, profit factor, trade count, average trade, average win, average loss, trading costs, monthly consistency, long side contribution, short side contribution, and sensitivity to market regime.
Max drawdown matters because it shows how deep the strategy fell during the test. Win rate matters, but only when compared with average win and average loss. Trade count matters because it shows how active the strategy is and how exposed it may be to execution costs. Profit factor helps show whether the gains are meaningfully larger than the losses over the full set of trades.
The important habit is to compare metrics together. A higher return with a much higher trade count deserves more scrutiny. A lower drawdown with much lower return may still be attractive. A strong win rate with poor average loss control may still be fragile.
A backtest should help the trader understand the full profile, not just the headline result.
What This Case Study Taught
The biggest lesson from this test was not that one variation was clearly right and the others were wrong. The lesson was that each variation answered a different question.
The long only versions helped show how the idea behaved when restricted to one side of the market. The bi directional versions helped show whether the idea could also find opportunity when the market gave short side setups. The slower timeframe showed a calmer but less aggressive profile. The faster timeframe showed more activity and stronger results, but also raised more questions about costs and execution.
That is exactly what a good test should do. It should make the trader more informed, not just more excited.
A weak testing process asks, which version made the most money. A stronger testing process asks, why did this version perform better, what risks did it introduce, and what should be validated next.
What Still Needs Validation
Even after a promising comparison, the work is not finished. A backtest is historical. Live trading is forward looking. The gap between the two is where many strategies fail.
The next step would be to include realistic transaction costs, spreads, and slippage. This matters even more for the faster timeframe versions because they generate more trades. A cost assumption that looks small on one trade can become meaningful across thousands of trades.
The next step after that is out of sample testing. The idea should be checked on data that was not used while shaping the strategy. It should also be reviewed across different market regimes, including trending, sideways, volatile, and bearish periods.
Paper trading is another important step. It helps the trader see how the strategy behaves on live market data without risking real capital. Paper trading cannot prove future profitability, but it can reveal execution issues, signal frequency differences, and whether the strategy behaves as expected outside a historical backtest.
A strategy should not move from one good backtest to live deployment. It should move through layers of validation.
How FlyTradr Fits This Workflow
FlyTradr is designed around this kind of workflow. The goal is not just to help traders create strategies without code. The bigger goal is to help them test ideas more carefully before they risk capital.
A trader can start with a broad idea, turn it into rules using the Strategy Builder, run historical tests in the Backtesting Lab, compare variations through batch testing, and then move toward simulation or paper trading before considering live deployment.
That workflow matters because most strategy ideas need refinement. A trader may start with one version, then test another timeframe, remove one side of the strategy, add a different filter, or check whether the idea behaves differently in another market. Each test adds evidence.
The value is not only in finding a strong result. The value is in understanding the tradeoffs behind the result.
Key Takeaways
One backtest is not enough to trust a trading strategy.
The same broad idea can behave very differently across timeframe and trade direction.
Long only and bi directional versions answer different questions, neither is automatically better.
More trades can create more opportunity, but they can also increase cost and execution risk.
A strong backtest should lead to deeper validation, including costs, slippage, out of sample testing, and paper trading.
The goal is not to copy a strategy, but to stress test the idea until the tradeoffs are clear.
The Bottom Line
A backtest is useful, but it is not proof. It is a way to ask better questions.
The purpose of this Bollinger Band case study was not to share a strategy that someone should copy. It was to show why variation testing matters. The same broad idea changed meaningfully when timeframe and trade direction changed, and that is exactly the kind of information a trader needs before trusting a system.
A strong strategy development process is not about finding the most exciting result as quickly as possible. It is about understanding the idea properly. That means testing variations, comparing the full metric profile, checking the market context, and validating the result before real capital is involved.
That is how a trading idea moves from assumption to evidence.
Comments
Ask a question or leave feedback. Guests can post too.
Max 2000 characters.
No comments yet.
Quick answers
What is this article about?
A single backtest can make a trading idea look stronger than it really is.
Who should read this article on Why One Backtest Is Not Enough, A Practical Guide To Stress Testing Trading Ideas?
This article is for retail traders who want a practical understanding of why one backtest is not enough, a practical guide to stress testing trading ideas before moving into backtesting, simulation, paper trading, or broker-connected execution.
What should I do after reading this article?
Use the article to clarify the concept first, then review FlyTradr workflow pages such as the algo trading platform overview, methodology and assumptions, or the FAQs page before making a platform decision.