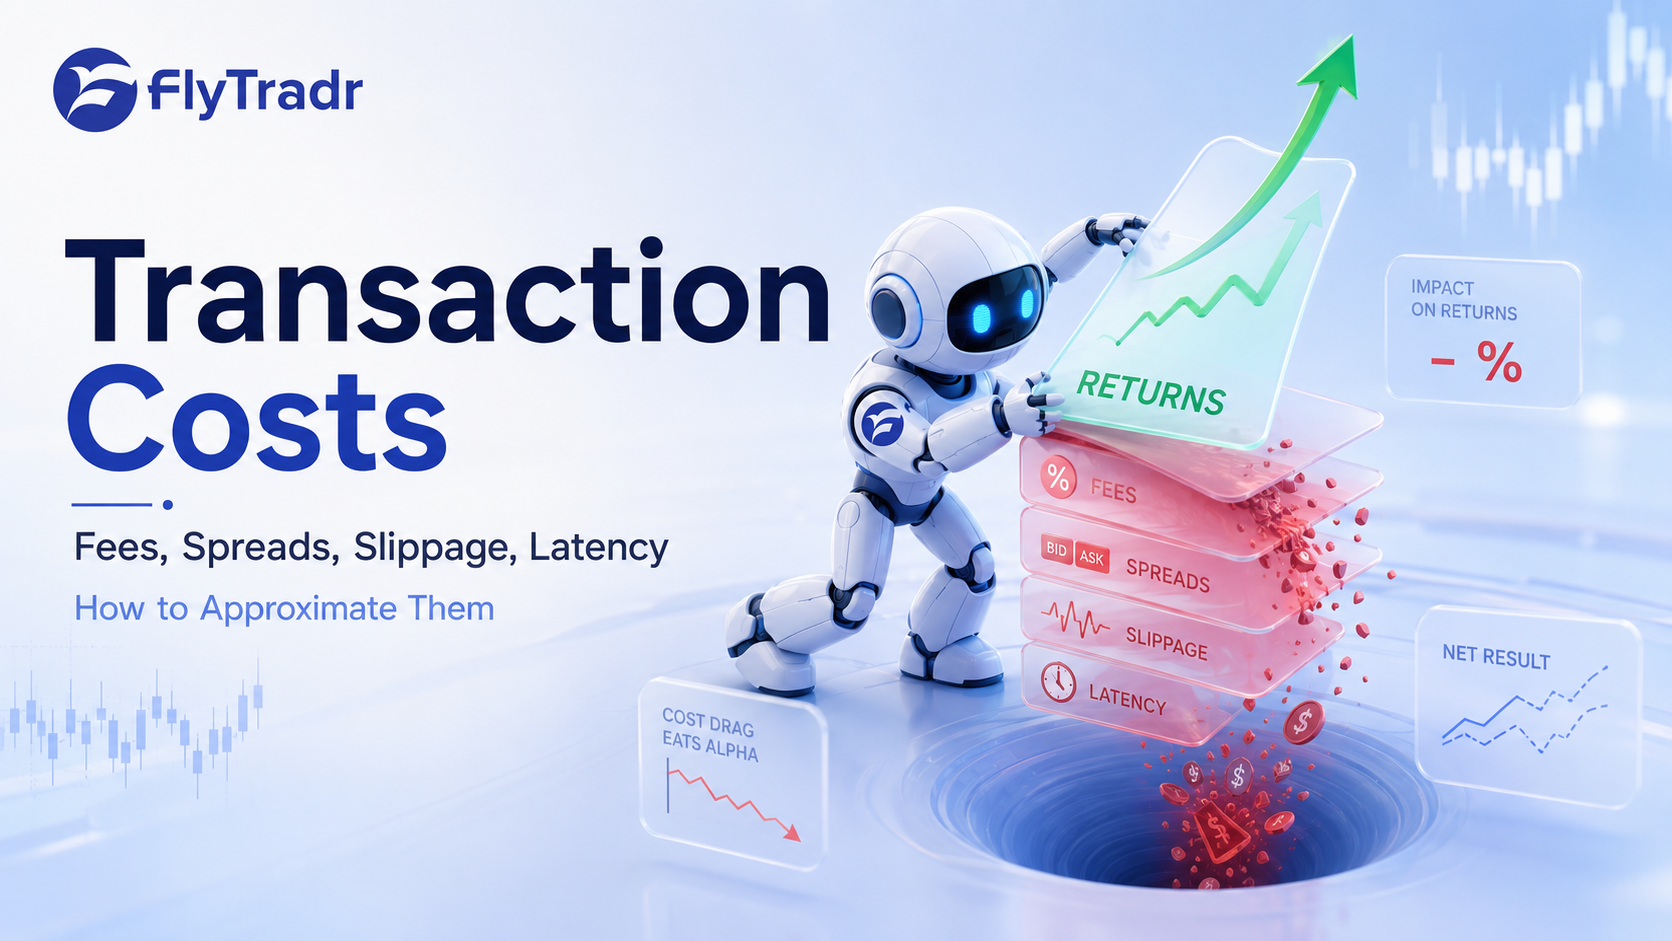
Transaction Costs. Fees. Spreads. Latency. How to Approximate Them
Your backtest shows 45 percent annual returns.
You deploy it live. After 6 months, you are up 12 percent.
What happened to the other 33 percent.
Transaction costs.
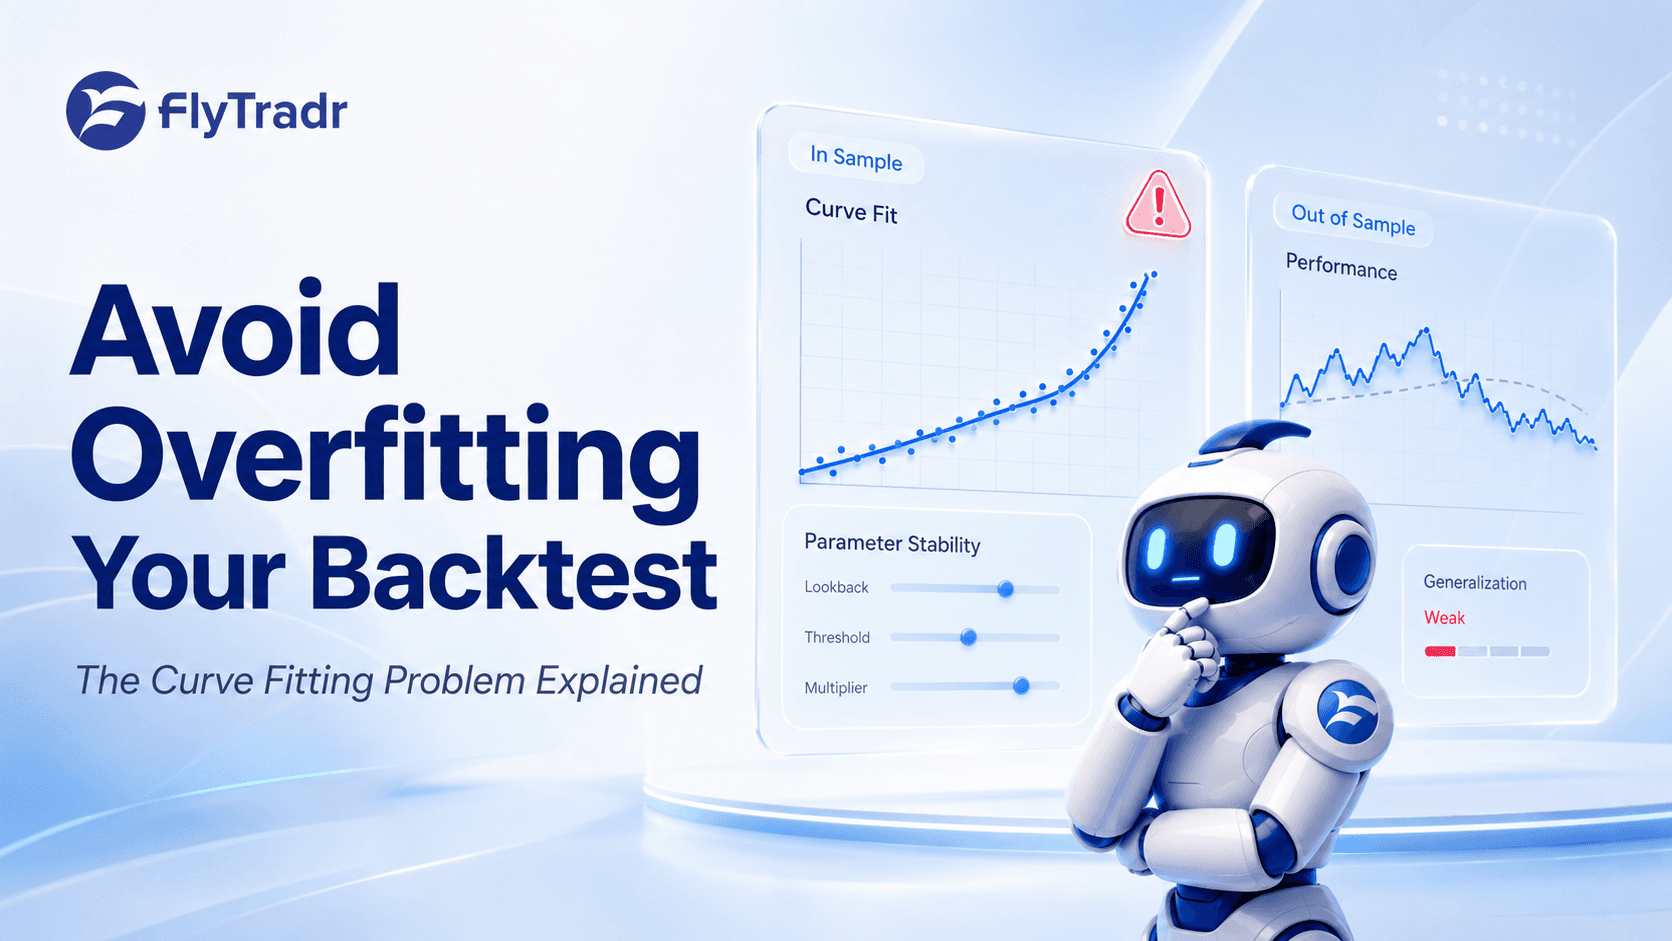
This guide explains the 5 main types of transaction costs, how to estimate each one, how costs vary by instrument and broker, how to model them in backtests, and why they can turn a profitable strategy into a losing one.
The 5 Types of Transaction Costs.
1. Commissions.
Commissions are the fees your broker charges per trade.
Some brokers advertise zero commission trading, but zero commission does not mean zero cost. You may still pay through wider spreads, worse execution quality, regulatory charges, or payment for order flow.
For stocks, commissions are often zero with many retail brokers. For options, costs are usually charged per contract. For futures, brokers commonly charge per contract. The exact number depends on your broker, market, and account type.
How to estimate commissions.
Check your broker fee schedule before running a serious backtest. Do not assume zero cost unless your actual broker confirms it.
Example.
Suppose your strategy takes 100 trades per year and your broker charges 1 dollar per trade. Your annual commission cost is 100 dollars.
If your average profit per trade is 50 dollars, your gross profit is 5000 dollars. After 100 dollars in commissions, your net profit becomes 4900 dollars. The impact is small, but still real.
2. Spreads.
The spread is the difference between the bid price and the ask price.
When you buy, you usually pay the ask. When you sell, you usually receive the bid. That gap is a real trading cost.
Highly liquid instruments usually have tight spreads. Large ETFs and large cap stocks may have very narrow spreads. Mid cap stocks, small cap stocks, and illiquid options can have much wider spreads.
How to estimate spreads.
Open your trading platform and look at the bid and ask quotes. The spread is the ask price minus the bid price. Check this at different times of day, because spreads often widen near the market open, near the close, during news events, and outside normal market hours.
Example.
If SPY has a bid of 449.99 dollars and an ask of 450.00 dollars, the spread is 1 cent.
If you trade 100 shares and pay the spread on both entry and exit, that small spread can still add up over many trades.
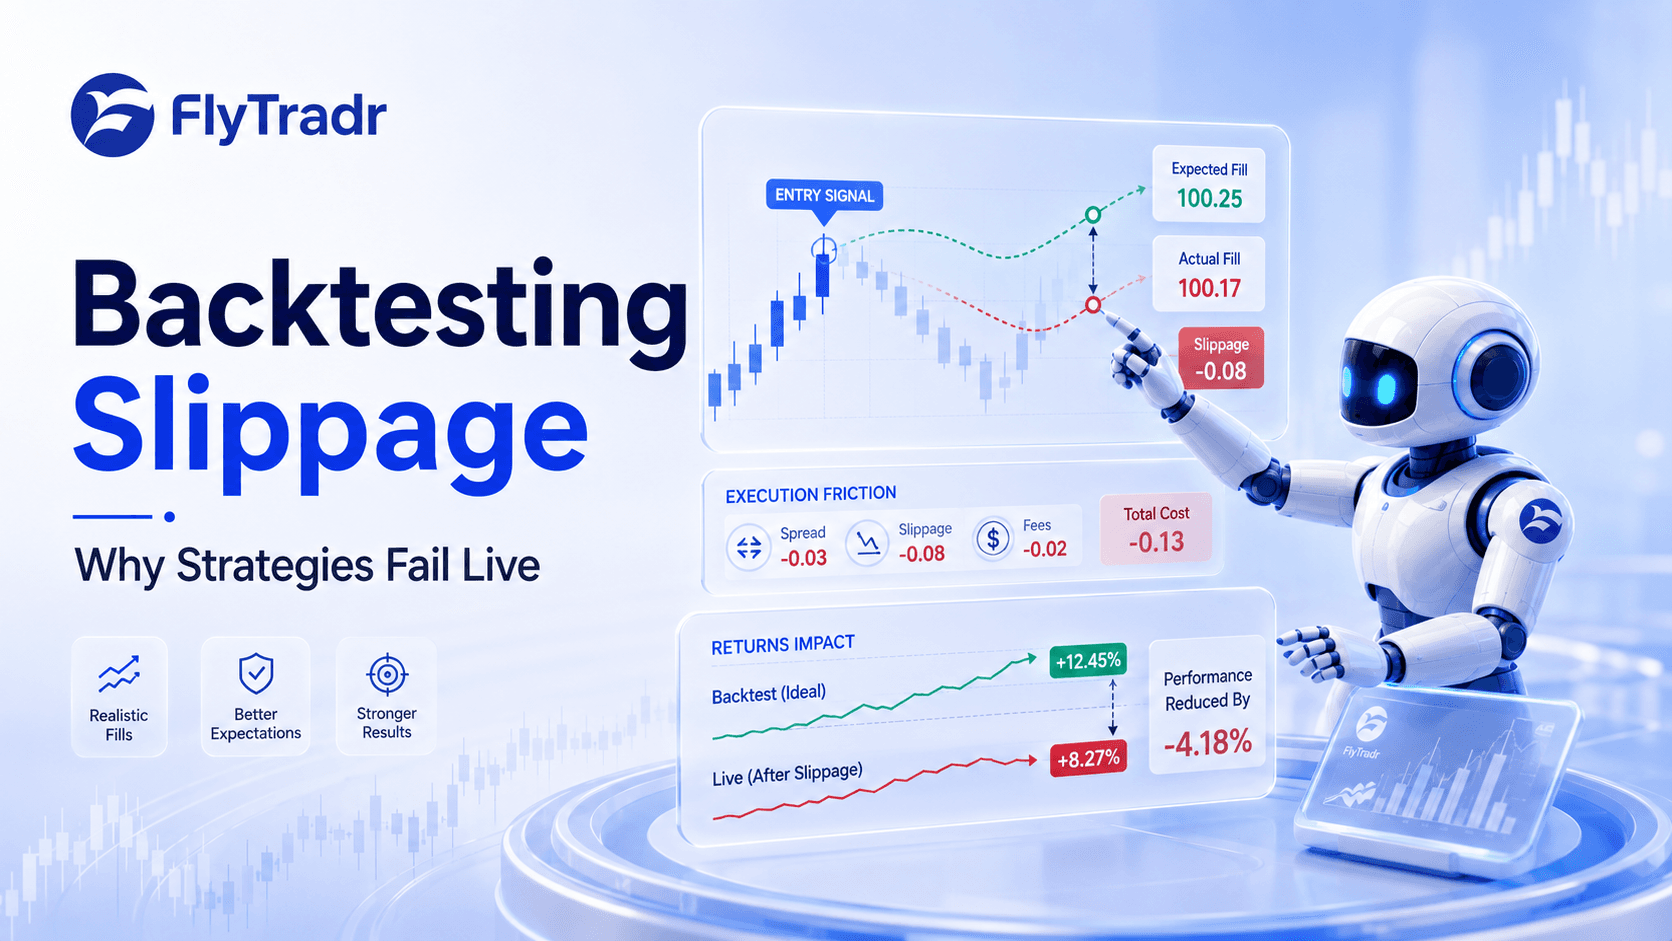
3. Slippage.
Slippage is the difference between the price your backtest assumes and the price you actually receive in live trading.
It happens because markets move, order books change, and your order may not fill at the exact price shown on the chart.
Market orders usually create more slippage because they accept the available price. Fast moving markets create more slippage because price can change between signal generation and execution. Illiquid instruments create more slippage because your order may need to fill across multiple price levels.
How to estimate slippage.
The best method is to review your broker execution reports and compare expected prices with actual fill prices.
If you do not have enough live data, use conservative assumptions. For liquid instruments, assume a small slippage amount per trade. For mid cap stocks, assume more. For small cap stocks, options, and lower liquidity instruments, assume significantly more.
A useful rule of thumb is that slippage on market orders may be around half the spread to one full spread, depending on liquidity and speed.
Example.
Suppose your strategy takes 200 trades per year, your average slippage is 5 cents per share, and you trade 100 shares each time.
Your slippage cost per trade is 5 dollars. Across 200 trades, that becomes 1000 dollars.
If your gross profit is 10000 dollars, slippage alone reduces your profit by 10 percent.
4. Market Impact.
Market impact is the cost created when your own order moves the price against you.
For small retail accounts trading highly liquid instruments, market impact is often negligible. For larger accounts, or for any account trading illiquid instruments, it can matter.
Market impact depends on order size relative to average daily volume. If your order is a tiny fraction of daily volume, the impact is usually small. If your order is a meaningful share of daily volume, your own buying or selling can move the market.
How to estimate market impact.
Compare your order size with average daily volume.
If your order is less than 0.1 percent of daily volume, market impact is usually minimal. If it is between 0.1 percent and 1 percent, impact may be small but worth considering. If it is above 1 percent, impact can become meaningful. If it is above 5 percent, impact can be large.
Example.
Suppose you buy 10000 shares of a stock that trades 1000000 shares per day. Your order is 1 percent of daily volume.
If the stock trades at 50 dollars and your order moves the effective entry price by 3 cents, your market impact cost is 300 dollars.
5. Latency Slippage.
Latency slippage is the cost caused by delay between signal generation and order execution.
On daily strategies, a delay of 1 or 2 seconds usually does not matter much. On 1 minute strategies, that delay can materially change the fill price. On scalping strategies, a few seconds can completely destroy the edge.
Retail web platforms and mobile apps usually have more latency than direct market access. Professional setups with colocated servers have much lower latency, but those are not realistic for most retail traders.
How to estimate latency.
The simple method is to measure how long it takes from signal generation to order confirmation. Repeat this several times and calculate the average.
A conservative assumption for many retail setups is 1 to 3 seconds.
Another method is to test your strategy with delayed execution. In your backtest, delay order execution by 1 to 3 bars depending on the timeframe and compare results against instant execution.
Example.
A 1 minute momentum strategy triggers a buy at 450 dollars. The backtest assumes a fill at 450 dollars. In live trading, a 2 second delay means the actual fill happens at 450.10 dollars.
That 10 cent difference may look small. Across 200 trades of 100 shares each, it becomes 2000 dollars.
How Transaction Costs Compound.
Transaction costs become dangerous when trade frequency rises.
A strategy that trades 50 times per year can often survive modest costs. A strategy that trades 500 times per year needs a much larger edge because every trade pays some combination of spread, slippage, commissions, and execution friction.
Suppose your total cost per trade is 8 dollars.
At 100 trades, your annual cost is 800 dollars.
At 500 trades, your annual cost is 4000 dollars.
If your average profit per trade is 20 dollars, these costs can remove a large part of your edge.
The lesson is simple. High frequency strategies need a much stronger edge to overcome costs.
How to Model Transaction Costs in Backtests.
Method 1: Fixed Cost Per Trade.
The simplest method is to assign a fixed cost to every trade. For example, you might subtract 10 dollars from every trade to account for commissions, spread, and slippage.
This method is quick and useful for rough estimates.
The weakness is that it does not account for position size, changing spreads, or differences between liquid and illiquid instruments.
Use this method for early testing, not final validation.
Method 2: Percentage Based Cost.
A better method is to model costs as a percentage of trade value.
For example, you might assume 0.1 percent per trade to cover spread, slippage, and commission.
This scales better with position size and is more realistic than a fixed cost.
The weakness is that it still does not fully reflect actual spread structure. It may overestimate costs on highly liquid instruments and underestimate them on illiquid ones.
Use this method when your strategy has variable position sizes.
Method 3: Component Based Cost.
The most accurate method is to model each cost separately.
You model commissions as a fixed or per share charge. You model spread using average bid ask spread. You model slippage using a per share or percentage assumption. You model latency by delaying execution in the backtest.
This method takes more effort, but it gives a much more honest picture.
Use this method before deploying real capital.
How to Reduce Transaction Costs.
1. Trade Less Frequently.
The easiest way to reduce costs is to reduce trade frequency.
A strategy that trades 500 times per year with 10 dollars of cost per trade pays 5000 dollars in costs.
A strategy that trades 50 times per year with the same cost per trade pays only 500 dollars.
You can reduce trade frequency by adding filters, tightening entry conditions, using higher timeframes, or avoiding low quality signals.
2. Use Limit Orders When Possible.
Market orders accept the available price. Limit orders give you control over the maximum price you are willing to pay or the minimum price you are willing to accept.
Limit orders can reduce spread and slippage costs, especially in mean reversion strategies where you can wait for price to come to your level.
The tradeoff is that your order may not fill.
3. Trade Liquid Instruments.
Liquidity matters.
A liquid ETF or large cap stock may have a very tight spread and low slippage. A small cap stock may have a much wider spread and worse execution.
If two strategies produce similar returns, the one trading more liquid instruments is usually easier to execute in real life.
4. Avoid Volatile Periods.
Costs are often higher during the market open, major news releases, and periods of sudden volatility.
Spreads widen. Slippage increases. Market orders become more dangerous.
For many retail strategies, avoiding the first part of the session and major news events can reduce execution friction.
5. Choose the Right Broker.
A low commission broker is not always the cheapest broker.
If one broker charges zero commission but gives poor fills, and another broker charges a small commission but gives better execution, the second broker may be cheaper in practice.
Execution quality matters as much as headline fees.
A Real World Example.
Consider two strategies.
Strategy A is a high frequency momentum strategy.
It takes 500 trades per year. The average profit per trade in the backtest is 25 dollars. It trades mid cap stocks.
Assume 1 dollar in commission, 5 dollars in spread cost, and 10 dollars in slippage cost per trade. Total cost per trade is 16 dollars.
Gross profit is 12500 dollars. Total costs are 8000 dollars. Net profit becomes 4500 dollars.
Costs consumed 64 percent of the gross profit.
Strategy B is a low frequency trend following strategy.
It takes 50 trades per year. The average profit per trade is 200 dollars. It trades a liquid ETF.
Assume 1 dollar in commission, 1 dollar in spread cost, and 2 dollars in slippage cost per trade. Total cost per trade is 4 dollars.
Gross profit is 10000 dollars. Total costs are 200 dollars. Net profit becomes 9800 dollars.
Costs consumed only 2 percent of the gross profit.
The lesson is clear. Low frequency strategies with larger average profits per trade handle transaction costs much better.
How FlyTradr Models Transaction Costs.
FlyTradr Backtesting Lab includes configurable cost modelling so traders can compare idealised results with more realistic results.
You can model fixed slippage, percentage slippage, spread based assumptions, and broker commissions.
You can also compare results before and after costs. This helps you see whether the strategy still works after realistic execution assumptions are included.
For example, a strategy may show 45 percent total return before costs and 28 percent total return after costs. The strategy may still be viable, but expectations are now more realistic.
That is the point of cost modelling. It does not make the backtest look better. It makes the backtest more honest.
The Bottom Line.
Transaction costs are not optional.
If your backtest does not model them, your backtest is incomplete.
The 5 cost types are commissions, spreads, slippage, market impact, and latency.
Together, they can reduce returns by 10 percent to 50 percent or more, depending on trade frequency, liquidity, order type, and broker execution quality.
The best way to reduce costs is to trade less frequently, use liquid instruments, use limit orders where appropriate, avoid volatile periods, and choose brokers based on execution quality, not just headline commission.
Transaction costs are the tax on trading. Pay them in your backtest, not with your capital.
Ready to model realistic transaction costs. Start testing with accurate cost assumptions at FlyTradr.
Comments
Ask a question or leave feedback. Guests can post too.
Max 2000 characters.
No comments yet.
Quick answers
What is this article about?
Transaction costs can turn a profitable backtest into a losing strategy.
Who should read this article on Transaction Costs: Fees, Spreads, Latency—How to Approximate Them?
This article is for retail traders who want a practical understanding of transaction costs: fees, spreads, latency—how to approximate them before moving into backtesting, simulation, paper trading, or broker-connected execution.
What should I do after reading this article?
Use the article to clarify the concept first, then review FlyTradr workflow pages such as the algo trading platform overview, methodology and assumptions, or the FAQs page before making a platform decision.