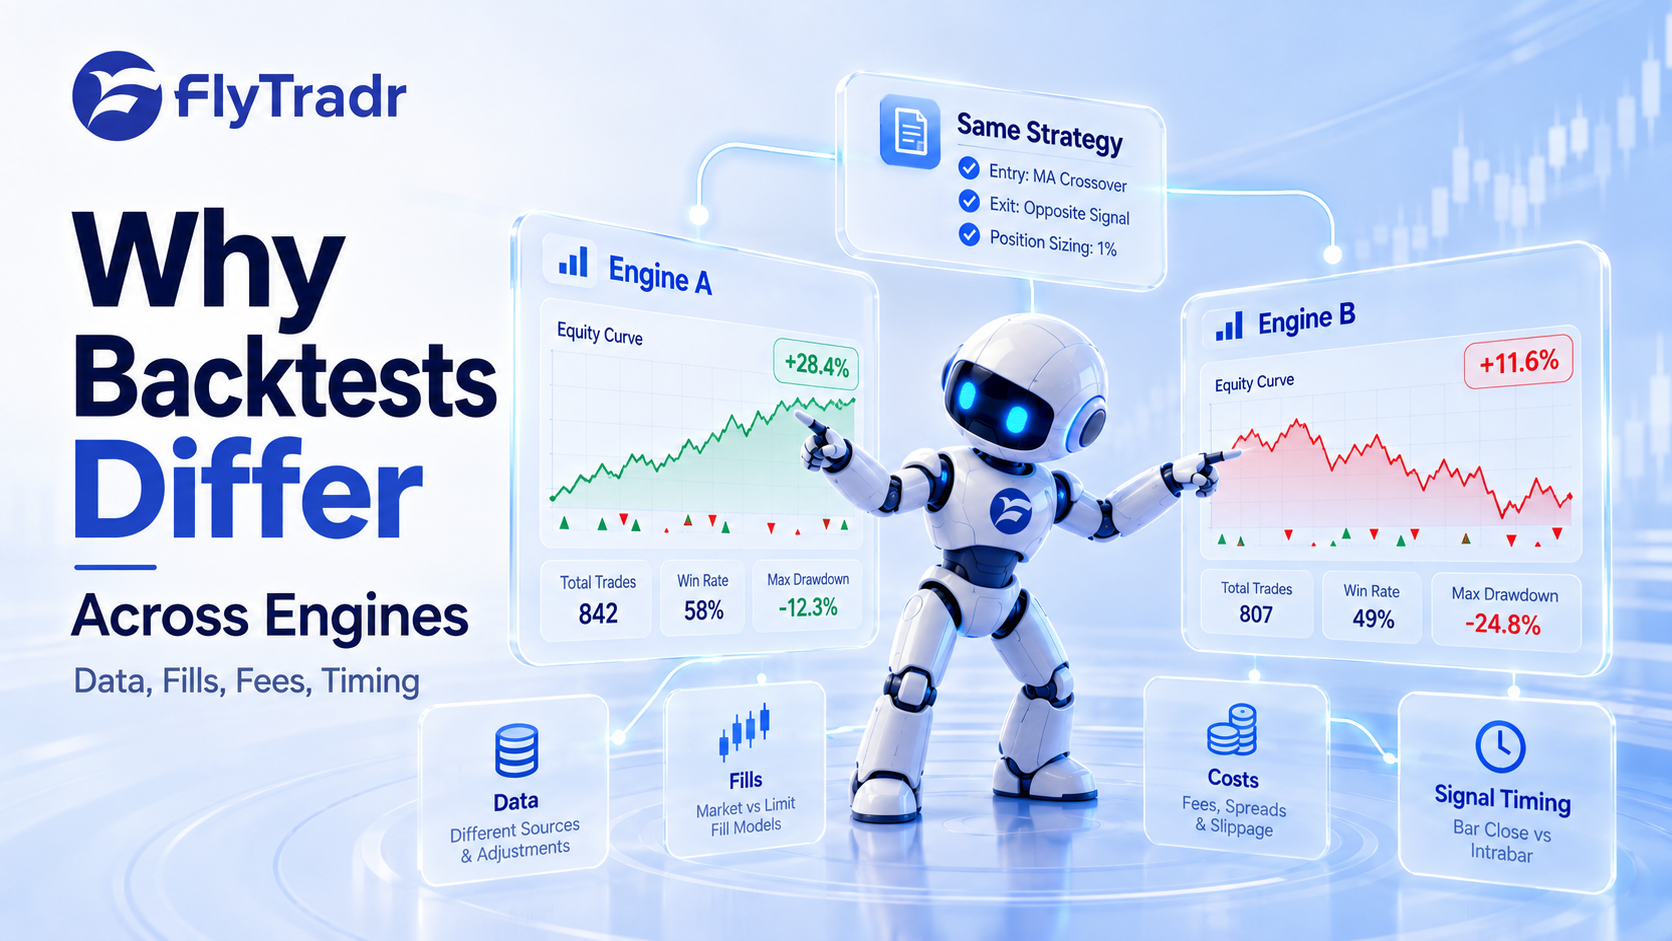
Why the Same Strategy Can Produce Different Results in Two Backtesting Engines
You build a strategy in one backtesting platform, run it over a historical period, and get a promising result. Later, you recreate what appears to be the same strategy in another tool, using the same instrument and timeframe. This time, the return is much lower. The drawdown is different, the number of trades does not match, and some entries appear on different candles.
Which backtest should you believe?
It is tempting to conclude that one platform is inaccurate, especially if you have spent time refining the strategy in the other. There certainly can be software defects or bad data. But two backtests can also disagree because the engines are testing different interpretations of the same idea. Those differences may be hidden in the historical data, indicator calculations, signal timing, order handling, or transaction costs.
This matters because a backtest is not a record of trades that actually happened. It is a simulation built from rules and assumptions. If two platforms make different assumptions, they can produce different results without either platform necessarily being defective.
The useful response is to investigate where the results begin to diverge. Once you understand the disagreement, you are in a better position to judge the strategy and the assumptions behind it.
What Does the Same Strategy Really Mean?
Two strategies can share a name, the same indicators, and even the same displayed settings while behaving differently in practice. Take a moving average crossover as an example. Both platforms might show a fast moving average, a slow moving average, and an instruction to buy when the fast average crosses above the slow one. That looks identical at a glance.
But the details still matter. Are both moving averages calculated from closing prices? Are they using the same historical bars? Is a crossover considered valid during a forming candle or only after that candle closes? Does the entry happen on the signal candle, at the next open, or after a simulated order delay? What happens if an exit and a new entry become eligible on the same bar?
A small difference in one of those answers can move the first trade. Once the first trade changes, subsequent available capital, position size, exposure, and future trades may also change. Over a long backtest, several minor differences can produce noticeably different equity curves.
Before comparing performance, then, the first task is to establish whether the two engines are genuinely testing the same rules and execution model.
Historical Market Data Is Not Always Identical
Historical data is one of the most important sources of disagreement. Two providers may offer price histories for the same symbol and timeframe without supplying identical candles.
The differences can come from trading-session definitions, exchange or venue selection, time zones, data corrections, missing bars, and corporate-action adjustments. A stock-price history adjusted for splits or dividends is not necessarily equivalent to an unadjusted history. For cryptocurrencies, data can differ across exchanges because the instruments trade on different order books with their own prices and liquidity.
Even bar boundaries matter. If one platform builds hourly candles starting at a different time from another, the high, low, open, and close of each hour may differ. An indicator using those candles can then produce different values, and a signal that exists on one platform may not appear on the other.
The first comparison should be the underlying prices, not the final returns. Select a few dates around a disputed trade and check the open, high, low, close, timestamps, and trading sessions in both tools. If the underlying candles differ, there is little value in debating which signal calculation is correct until the data difference is understood.
Corporate Actions and Changes in the Historical Universe
For equity strategies, corporate actions deserve particular attention. Stock splits, dividends, mergers, and symbol changes can affect historical prices and the continuity of a dataset. A strategy tested on adjusted data may produce different signals from one tested on raw traded prices unless its logic and order model account for those adjustments consistently.
Portfolio or stock-selection backtests have another concern. One platform may use today's surviving symbols, while another may include historical constituents and delisted securities. These tests may not even be evaluating the same opportunity set. This is a data-universe issue rather than a minor difference in trade execution, and it should be resolved before the strategies are compared.
Indicator Calculations and Warm-Up Periods
Indicator names can create a false sense of consistency. Two platforms may both offer an exponential moving average, RSI, ATR, or another familiar indicator, yet still produce slightly different values because their calculation or initialization choices differ.
Consider an exponential moving average. Its current value depends in part on earlier values. If one engine begins the calculation with a different initial seed or has more historical data available before the formal test window, the early indicator values may differ. This is often described as an indicator warm-up issue.
Other differences can come from the selected price source, smoothing method, standard-deviation convention, missing-data handling, or rounding. Not every platform exposes all of these details in the interface.
For strategies whose signals depend on close thresholds, even a small calculation difference may change whether a condition becomes true. It may shift an entry by one bar or prevent the trade altogether.
When results disagree, compare the indicator values directly around the first disputed signal. Also check whether both engines have enough data before the test period to initialize the indicators consistently. The warm-up period should not be confused with the period used to measure strategy performance.
Signal Timing and Fill Timing Are Separate Decisions
One of the most consequential differences between backtesting engines is when a trade is allowed to happen.
Suppose a daily strategy buys after the closing price moves above a moving average. The completed daily close is only known when the candle has finished. If an engine assumes the strategy can use that completed close and receive a fill at the same closing price without an appropriate order mechanism, the result may be optimistic.
Another engine may confirm the signal at the daily close and simulate execution at the next available open. These two models can produce different entry prices, especially when the market gaps between sessions. Across many trades, the gap can materially change returns and drawdown.
That does not mean all same-close execution is invalid. Certain order types and predefined execution processes may allow participation at a closing auction. The important distinction is whether the strategy could realistically submit the order using information available before the relevant execution cutoff. A signal that relies on the final completed close cannot simply be assumed to have been known earlier.
Intrabar strategies add another layer of complexity. If a rule responds while a candle is forming, an engine needs sufficiently detailed data or a clearly defined approximation of what happened inside the candle. A strategy using only completed candles is a different strategy from one responding to temporary intrabar movements.
This is why signal time, order submission time, and fill time should be defined separately. A backtest that leaves those steps ambiguous is difficult to compare or reproduce.
Stops, Targets, and the Intrabar Sequence Problem
Stop-loss and take-profit handling can also produce large differences between platforms, especially when tests use relatively large candles.
Imagine a long position with both a stop loss and a profit target. During one candle, the recorded high reaches the target while the low also falls through the stop. From the candle's open, high, low, and close alone, you cannot necessarily tell which level was touched first.
One engine may use a conservative sequence assumption. Another may apply a different intrabar path model, use lower timeframe data, or prioritize orders differently. Those choices can turn the same bar into either a winning or losing trade.
The disagreement becomes especially important for short-term strategies, tight stops, and strategies that frequently enter and exit within the same candle. If the available data cannot establish the actual order of events, the test should make its assumption visible rather than quietly selecting the favourable outcome.
Order types matter too. A stop order does not guarantee a fill at the stop price in a fast market. A limit order controls its price, but a touched limit price does not automatically mean sufficient liquidity was available to fill the order. Two engines that model these cases differently may show different trade counts and average execution prices.
Transaction Costs Can Change the Entire Result
Fees, spread, slippage, and funding or borrowing costs are another major source of variation. Two platforms may show similar gross results but different net results because they account for different frictions.
This is particularly relevant when a strategy generates many trades or has only a small average profit per trade. A seemingly minor change in round-trip cost can erase a substantial part of the expected edge. One engine might apply a commission but ignore the spread. Another might include a spread estimate and slippage at both entry and exit. Neither result can be interpreted fairly until the cost assumptions are compared.
The cost model should also match the market and trade direction. Equity commissions, exchange fees, futures funding, short borrow costs, and crypto trading fees are not interchangeable. A model that is reasonable for a liquid instrument may be inadequate for a thinly traded one.
When comparing engines, examine gross profit, total costs, and net profit separately. If the signals and fill prices are broadly similar but net results differ, costs may explain much of the gap.
Capital, Position Sizing, and Portfolio Accounting
Backtesting platforms can also differ in how they allocate capital and account for positions.
One engine may size each trade using a fixed cash amount, while another uses a percentage of current equity. Some models reinvest profits immediately; others use the initial capital as the sizing reference. Position rounding, leverage, margin requirements, minimum order size, and rules for overlapping positions may vary as well.
These differences are easy to miss because the strategy's entry and exit signals can still look identical. But a trade executed with a different quantity changes profit and loss, and a difference in available capital may determine whether the next trade can be placed at all.
For multi-strategy or portfolio testing, the issue becomes larger. Strategies may share a capital pool or be treated as independent accounts. If two signals arrive together, the engine must decide how much capital each receives and whether both can execute. A portfolio model cannot be compared meaningfully with a collection of isolated strategy backtests unless these assumptions are aligned.
A Practical Way to Investigate Two Conflicting Backtests
When two platforms disagree, avoid starting with the final percentage return. The most useful investigation usually begins with the first trade where their behaviour differs.
1. Freeze the Strategy Version
Keep one fixed set of rules while investigating. Do not change the indicator values or entry filters simply to make one platform's performance resemble the other. That would introduce a new variable before the original difference has been explained.
Record the exact entry and exit conditions, price sources, indicator settings, risk rules, and any other configuration relevant to the test.
2. Match the Test Environment
Use the same market, instrument, timeframe, date range, timezone, and starting capital wherever the platforms permit. Match position sizing, commission assumptions, slippage, order types, and execution timing as closely as possible.
If the tools do not allow exact alignment, document the difference. The goal is to identify what is comparable and what remains uncertain, not to pretend the tests are identical.
3. Compare Prices and Indicator Values
Choose the first disputed trade and inspect the surrounding candles. Compare timestamps, price data, and indicator readings. This can reveal a data-source difference, an indicator initialization issue, or a signal evaluated at a different point within the bar.
4. Compare the Trade Lists
Once the underlying data and signals are understood, compare entry timestamps, entry prices, exit timestamps, exit prices, order quantities, and costs. Does one platform show a trade the other never placed? Did both enter but at different prices? Did one stop out during a candle that the other treated as a winner?
Following the first disagreement is usually more informative than comparing hundreds of aggregated metrics. A single timing or sizing difference can create later differences in capital and trade eligibility.
5. Recheck the Strategy Under Conservative Assumptions
After identifying the cause, run tests with assumptions that are defensible for the intended execution process. If a strategy only looks attractive when every signal receives a perfect same-bar fill, that is important evidence about its sensitivity.
This final step is about understanding the model's fragility. It is not about forcing the two equity curves to match exactly.
Different Results Do Not Automatically Mean One Engine Is Wrong
Two backtests can disagree because one contains an error, because both contain errors, or because they use different but internally consistent simulation models. The size of the disagreement alone does not tell you which explanation is correct.
This is why transparency matters. An engine that exposes its data assumptions, trade list, execution rules, and cost model gives you a better chance of explaining the outcome. A platform that produces one attractive headline number without enough information to investigate it leaves more unanswered questions.
A healthy research process makes these differences visible. The point of comparing engines is to learn how the strategy behaves under the assumptions you are likely to encounter, including the uncomfortable ones.
How FlyTradr Fits the Workflow
FlyTradr's Strategy Builder can help keep entry, exit, and risk rules explicit, while the Backtesting Lab provides a place to review historical results and trade behaviour. When translating a strategy from another platform, preserving the intended meaning of each condition is an important first step.
Rather than comparing only total return, examine the underlying strategy version, test configuration, trade count, drawdown, and execution assumptions. If another engine produces a different result, treat that difference as a question to investigate. Neither platform's result should be taken as proof of future performance.
Once the historical assumptions are understood, the Simulator and Paper Trader can support further observation of the strategy's behaviour before any live deployment is considered. Those stages offer additional evidence, but they do not erase the limitations of the historical test or guarantee live execution quality.
The Bottom Line
The same strategy can produce different results in two backtesting engines because the apparent strategy is only part of what is being tested. Historical data, indicator calculations, signal timing, fills, costs, position sizing, and portfolio accounting all contribute to the final result.
When the results disagree, freeze the rules, align the assumptions, and compare trades from the first point of divergence. Do not treat the better-looking equity curve as the correct one simply because it is more attractive.
A backtest is a model of how a strategy might have behaved under stated assumptions. Understanding those assumptions is what makes the result useful.
Comments
Ask a question or leave feedback. Guests can post too.
Max 2000 characters.
No comments yet.
Quick answers
What is this article about?
Two platforms can produce very different backtest results from what appears to be the same strategy.
Who should read this article on Why the Same Strategy Can Produce Different Results in Two Backtesting Engines?
This article is for retail traders who want a practical understanding of why the same strategy can produce different results in two backtesting engines before moving into backtesting, simulation, paper trading, or broker-connected execution.
What should I do after reading this article?
Use the article to clarify the concept first, then review FlyTradr workflow pages such as the algo trading platform overview, methodology and assumptions, or the FAQs page before making a platform decision.